Bug with legend position and the title of the second y axis
Chưa có ai nhận issue này.
- Ngôn ngữ chính
- R
- Star
- 2.7k
- Fork
- 641
- Chỉ số merge pull request
- Không có pull request nào được merge trong 30 ngày
Mô tả
When using plotly, I'm trying to have multiple axes on my graph, but when I switch the legend side to horizontal, the second y axis label overlays the ticks and is impossible to read. to show the problem, I'll use the exemple in the R plotly documentation, except that I add one line : legend = list(orientation = 'h'). The output it produces is attached. I can fix the problem by manually adding a marging, but I don't think that is the desired output of your function.
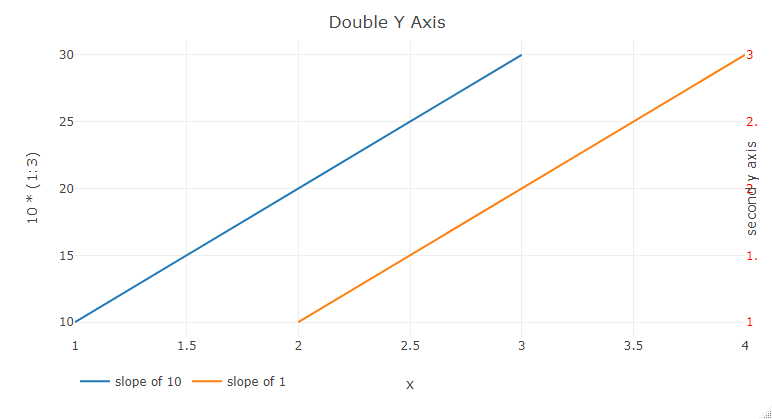
sorry for the broken reprex, I don't know how to add plotly as a library into the reprex.
Best
Xav
ay <- list(
  tickfont = list(color = "red"),
  overlaying = "y",
  side = "right",
  title = "second y axis"
)
fig <- plot_ly()
#> Error in plot_ly(): impossible de trouver la fonction "plot_ly"
fig <- fig %>% add_lines(x = ~1:3, y = ~10*(1:3), name = "slope of 10")
#> Error in fig %>% add_lines(x = ~1:3, y = ~10 * (1:3), name = "slope of 10"): impossible de trouver la fonction "%>%"
fig <- fig %>% add_lines(x = ~2:4, y = ~1:3, name = "slope of 1", yaxis = "y2")
#> Error in fig %>% add_lines(x = ~2:4, y = ~1:3, name = "slope of 1", yaxis = "y2"): impossible de trouver la fonction "%>%"
fig <- fig %>% layout(
  title = "Double Y Axis", yaxis2 = ay,
  xaxis = list(title="x"),
  legend = list(orientation = 'h')
)
#> Error in fig %>% layout(title = "Double Y Axis", yaxis2 = ay, xaxis = list(title = "x"), : impossible de trouver la fonction "%>%"

fig
#> Error in eval(expr, envir, enclos): objet 'fig' introuvable
Created on 2020-07-01 by the reprex package (v0.3.0)
Hướng dẫn đóng góp
Bắt đầu từ đâu
- Đọc hết issue, rồi đọc hướng dẫn đóng góp của dự án.
- Bình luận trên issue rằng bạn sẽ nhận — tránh hai người làm cùng một việc.
- Fork repository và làm thay đổi trên một nhánh.
- Mở pull request có tham chiếu số hiệu của issue.
Hướng nghiên cứu
Bắt đầu bằng cách tái hiện ví dụ trong tài liệu R plotly với trục y thứ hai và legend = list(orientation = 'h'); issue không nêu tên tệp nguồn hoặc test. So sánh layout thu được với output đính kèm và coi issue là hoàn tất khi tiêu đề của trục y thứ hai có thể đọc được mà không cần thêm margin thủ công.
Do mô hình lập chỉ mục viết ra từ nội dung của issue.
Đánh giá
- Công nghệ
- plotly, r
- Lĩnh vực
- data-visualization
- Loại issue
- Lỗi
- Độ khó
- 3/5
- Thời gian dự kiến
- 1-2 ngày
- Mức độ hoạt động
- Đình trệ
- Độ rõ ràng
- Khá rõ ràng
- Mức phù hợp với người mới
- 38/100