Bug with legend position and the title of the second y axis
还没有人认领这个 Issue。
- 主要语言
- R
- 星标
- 2.7k
- 派生
- 641
- PR 合并指标
- 30 天内没有已合并 PR
描述
When using plotly, I'm trying to have multiple axes on my graph, but when I switch the legend side to horizontal, the second y axis label overlays the ticks and is impossible to read. to show the problem, I'll use the exemple in the R plotly documentation, except that I add one line : legend = list(orientation = 'h'). The output it produces is attached. I can fix the problem by manually adding a marging, but I don't think that is the desired output of your function.
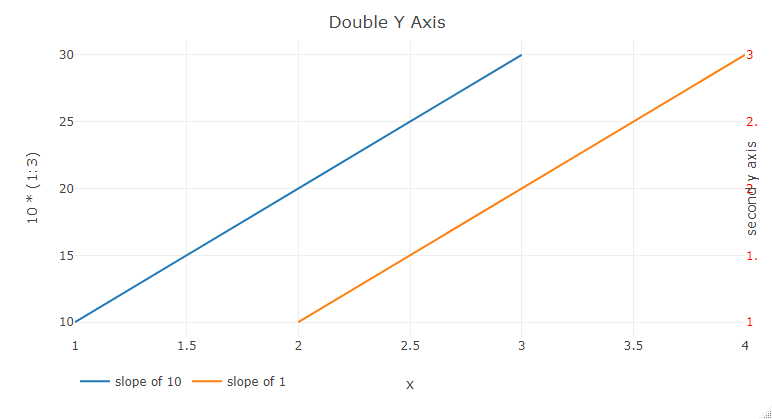
sorry for the broken reprex, I don't know how to add plotly as a library into the reprex.
Best
Xav
ay <- list(
  tickfont = list(color = "red"),
  overlaying = "y",
  side = "right",
  title = "second y axis"
)
fig <- plot_ly()
#> Error in plot_ly(): impossible de trouver la fonction "plot_ly"
fig <- fig %>% add_lines(x = ~1:3, y = ~10*(1:3), name = "slope of 10")
#> Error in fig %>% add_lines(x = ~1:3, y = ~10 * (1:3), name = "slope of 10"): impossible de trouver la fonction "%>%"
fig <- fig %>% add_lines(x = ~2:4, y = ~1:3, name = "slope of 1", yaxis = "y2")
#> Error in fig %>% add_lines(x = ~2:4, y = ~1:3, name = "slope of 1", yaxis = "y2"): impossible de trouver la fonction "%>%"
fig <- fig %>% layout(
  title = "Double Y Axis", yaxis2 = ay,
  xaxis = list(title="x"),
  legend = list(orientation = 'h')
)
#> Error in fig %>% layout(title = "Double Y Axis", yaxis2 = ay, xaxis = list(title = "x"), : impossible de trouver la fonction "%>%"

fig
#> Error in eval(expr, envir, enclos): objet 'fig' introuvable
Created on 2020-07-01 by the reprex package (v0.3.0)
贡献指南
从这里开始
- 先读完整个 Issue,再读项目的贡献指南。
- 在 Issue 下留言说明你要接手 —— 这能避免两个人做同样的事。
- Fork 仓库,在一个分支上完成修改。
- 提交 Pull Request,并在描述里引用这个 Issue 编号。
调研方向
首先,复现带有第二个 y 轴和 legend = list(orientation = 'h') 的 R plotly 文档示例;issue 未指定源文件或测试。将生成的 layout 与附加的输出进行比较,并在无需手动添加 margin 的情况下即可读取第二个 y 轴标题时,将 issue 视为完成。
由索引模型根据 Issue 内容生成。
评估
- 技术栈
- plotly, r
- 领域
- data-visualization
- Issue 类型
- 缺陷
- 难度
- 3/5
- 预计耗时
- 1-2 天
- 活跃度
- 停滞
- 描述清晰度
- 基本清楚
- 新手友好度
- 38/100