Bug with legend position and the title of the second y axis
まだ誰も着手していません。
- 主要言語
- R
- スター
- 2.7k
- フォーク
- 641
- PR マージ指標
- 30日以内にマージされた PR はありません
説明
When using plotly, I'm trying to have multiple axes on my graph, but when I switch the legend side to horizontal, the second y axis label overlays the ticks and is impossible to read. to show the problem, I'll use the exemple in the R plotly documentation, except that I add one line : legend = list(orientation = 'h'). The output it produces is attached. I can fix the problem by manually adding a marging, but I don't think that is the desired output of your function.
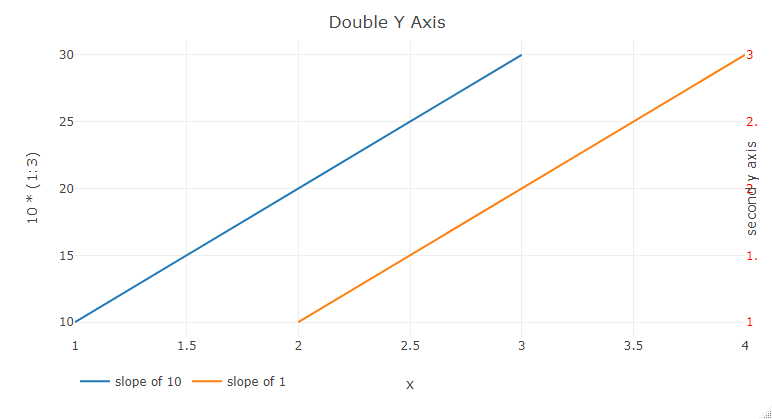
sorry for the broken reprex, I don't know how to add plotly as a library into the reprex.
Best
Xav
ay <- list(
  tickfont = list(color = "red"),
  overlaying = "y",
  side = "right",
  title = "second y axis"
)
fig <- plot_ly()
#> Error in plot_ly(): impossible de trouver la fonction "plot_ly"
fig <- fig %>% add_lines(x = ~1:3, y = ~10*(1:3), name = "slope of 10")
#> Error in fig %>% add_lines(x = ~1:3, y = ~10 * (1:3), name = "slope of 10"): impossible de trouver la fonction "%>%"
fig <- fig %>% add_lines(x = ~2:4, y = ~1:3, name = "slope of 1", yaxis = "y2")
#> Error in fig %>% add_lines(x = ~2:4, y = ~1:3, name = "slope of 1", yaxis = "y2"): impossible de trouver la fonction "%>%"
fig <- fig %>% layout(
  title = "Double Y Axis", yaxis2 = ay,
  xaxis = list(title="x"),
  legend = list(orientation = 'h')
)
#> Error in fig %>% layout(title = "Double Y Axis", yaxis2 = ay, xaxis = list(title = "x"), : impossible de trouver la fonction "%>%"

fig
#> Error in eval(expr, envir, enclos): objet 'fig' introuvable
Created on 2020-07-01 by the reprex package (v0.3.0)
コントリビューションガイド
はじめの一歩
- issue を最後まで読み、次にプロジェクトのコントリビューションガイドを読みます。
- 着手することを issue にコメントします — 二人が同じ作業をするのを防げます。
- リポジトリをフォークし、ブランチを切って変更します。
- issue 番号を参照したプルリクエストを送ります。
調査の方向性
まず、2 番目の y 軸と legend = list(orientation = 'h') を使用した R plotly ドキュメントの例を再現してください。issue ではソースファイルもテストも指定されていません。結果のレイアウトを添付された出力と比較し、手動でマージンを追加しなくても 2 番目の y 軸のタイトルが読めれば、issue は完了とみなしてください。
索引モデルが issue の本文から書いたものです。
評価
- 技術スタック
- plotly, r
- 領域
- data-visualization
- issue の種類
- バグ
- 難易度
- 3/5
- 見積もり時間
- 1〜2日
- 活発さ
- 停滞
- 明瞭さ
- おおむね明確
- 初心者へのやさしさ
- 38/100