Bug with legend position and the title of the second y axis
Nadie ha tomado este issue todavía.
- Lenguaje dominante
- R
- Estrellas
- 2.7k
- Forks
- 641
- Métricas de merge de PR
- Sin PR fusionados en 30 d
Descripción
When using plotly, I'm trying to have multiple axes on my graph, but when I switch the legend side to horizontal, the second y axis label overlays the ticks and is impossible to read. to show the problem, I'll use the exemple in the R plotly documentation, except that I add one line : legend = list(orientation = 'h'). The output it produces is attached. I can fix the problem by manually adding a marging, but I don't think that is the desired output of your function.
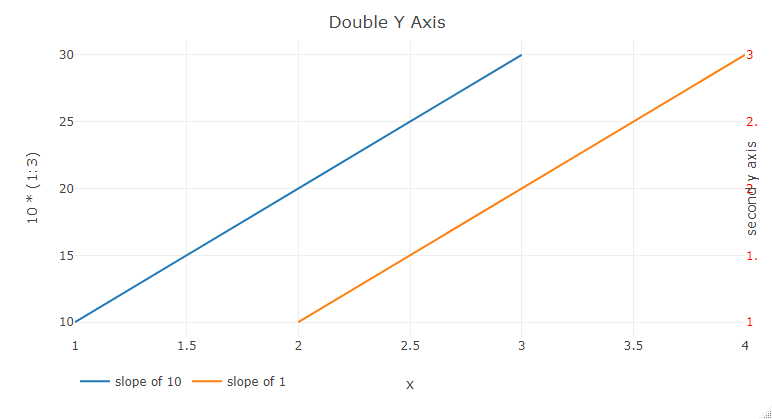
sorry for the broken reprex, I don't know how to add plotly as a library into the reprex.
Best
Xav
ay <- list(
  tickfont = list(color = "red"),
  overlaying = "y",
  side = "right",
  title = "second y axis"
)
fig <- plot_ly()
#> Error in plot_ly(): impossible de trouver la fonction "plot_ly"
fig <- fig %>% add_lines(x = ~1:3, y = ~10*(1:3), name = "slope of 10")
#> Error in fig %>% add_lines(x = ~1:3, y = ~10 * (1:3), name = "slope of 10"): impossible de trouver la fonction "%>%"
fig <- fig %>% add_lines(x = ~2:4, y = ~1:3, name = "slope of 1", yaxis = "y2")
#> Error in fig %>% add_lines(x = ~2:4, y = ~1:3, name = "slope of 1", yaxis = "y2"): impossible de trouver la fonction "%>%"
fig <- fig %>% layout(
  title = "Double Y Axis", yaxis2 = ay,
  xaxis = list(title="x"),
  legend = list(orientation = 'h')
)
#> Error in fig %>% layout(title = "Double Y Axis", yaxis2 = ay, xaxis = list(title = "x"), : impossible de trouver la fonction "%>%"

fig
#> Error in eval(expr, envir, enclos): objet 'fig' introuvable
Created on 2020-07-01 by the reprex package (v0.3.0)
Guía de contribución
Primeros pasos
- Lee el issue completo y luego la guía de contribución del proyecto.
- Comenta en el issue que vas a ocuparte — evita que dos personas hagan lo mismo.
- Haz un fork del repositorio y trabaja en una rama.
- Abre un pull request que haga referencia al número del issue.
Línea de trabajo
Comienza reproduciendo el ejemplo de la documentación de R plotly con un segundo eje y y legend = list(orientation = 'h'); el issue no indica ningún archivo fuente ni prueba. Compara el layout resultante con la salida adjunta y considera terminado el issue cuando el título del segundo eje y sea legible sin añadir manualmente un margen.
Escrito por el modelo de indexación a partir del texto del issue.
Evaluación
- Stack tecnológico
- plotly, r
- Área
- data-visualization
- Tipo de issue
- Error
- Dificultad
- 3/5
- Tiempo estimado
- 1-2 días
- Estado de actividad
- Estancado
- Claridad
- Bastante claro
- Aptitud para principiantes
- 38/100