Bug with legend position and the title of the second y axis
Personne n'a encore pris cette issue.
- Langage dominant
- R
- Étoiles
- 2.7k
- Forks
- 641
- Métriques de merge des PR
- Aucune PR mergée en 30 j
Description
When using plotly, I'm trying to have multiple axes on my graph, but when I switch the legend side to horizontal, the second y axis label overlays the ticks and is impossible to read. to show the problem, I'll use the exemple in the R plotly documentation, except that I add one line : legend = list(orientation = 'h'). The output it produces is attached. I can fix the problem by manually adding a marging, but I don't think that is the desired output of your function.
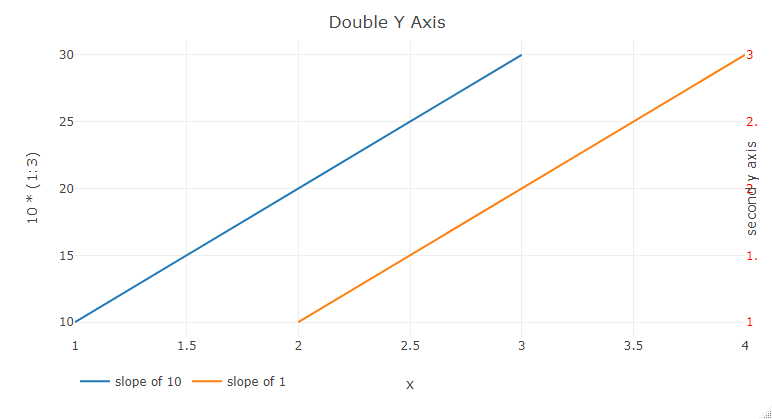
sorry for the broken reprex, I don't know how to add plotly as a library into the reprex.
Best
Xav
ay <- list(
  tickfont = list(color = "red"),
  overlaying = "y",
  side = "right",
  title = "second y axis"
)
fig <- plot_ly()
#> Error in plot_ly(): impossible de trouver la fonction "plot_ly"
fig <- fig %>% add_lines(x = ~1:3, y = ~10*(1:3), name = "slope of 10")
#> Error in fig %>% add_lines(x = ~1:3, y = ~10 * (1:3), name = "slope of 10"): impossible de trouver la fonction "%>%"
fig <- fig %>% add_lines(x = ~2:4, y = ~1:3, name = "slope of 1", yaxis = "y2")
#> Error in fig %>% add_lines(x = ~2:4, y = ~1:3, name = "slope of 1", yaxis = "y2"): impossible de trouver la fonction "%>%"
fig <- fig %>% layout(
  title = "Double Y Axis", yaxis2 = ay,
  xaxis = list(title="x"),
  legend = list(orientation = 'h')
)
#> Error in fig %>% layout(title = "Double Y Axis", yaxis2 = ay, xaxis = list(title = "x"), : impossible de trouver la fonction "%>%"

fig
#> Error in eval(expr, envir, enclos): objet 'fig' introuvable
Created on 2020-07-01 by the reprex package (v0.3.0)
Guide de contribution
Ouvrir le guide de contribution
Par où commencer
- Lisez l'issue en entier, puis le guide de contribution du projet.
- Signalez en commentaire que vous la prenez — cela évite que deux personnes fassent le même travail.
- Forkez le dépôt et travaillez sur une branche.
- Ouvrez une pull request qui référence le numéro de l'issue.
Piste de recherche
Commencez par reproduire l’exemple de la documentation R plotly avec un deuxième axe y et legend = list(orientation = 'h') ; l’issue ne nomme aucun fichier source ni aucun test. Comparez le layout obtenu avec la sortie jointe et considérez l’issue comme terminée lorsque le titre du deuxième axe y est lisible sans ajouter manuellement de marge.
Rédigé par le modèle d'indexation à partir du texte de l'issue.
Évaluation
- Stack technique
- plotly, r
- Domaine
- data-visualization
- Type d'issue
- Bug
- Difficulté
- 3/5
- Temps estimé
- 1-2 jours
- Activité
- À l'abandon
- Clarté
- Plutôt claire
- Accessibilité débutants
- 38/100