Analytics: When using ScreenTrackingService the average engagement time is calculated the wrong way
- 主要言語
- TypeScript
- スター
- 7.8k
- フォーク
- 2.2k
- 平均マージ
- 22時間 28分
- マージ済み PR(30日)
- 6
説明
### Version info
**Angular:**
"@angular/animations": "13.1.3",
"@angular/common": "13.1.3",
"@angular/compiler": "13.1.3",
"@angular/core": "13.1.3",
"@angular/forms": "13.1.3",
"@angular/platform-browser": "13.1.3",
"@angular/platform-browser-dynamic": "13.1.3",
"@angular/router": "13.1.3",
"rxjs": "7.4.0",
"tslib": "2.3.1",
"zone.js": "0.11.4",
"typescript": "4.5.5"
**Firebase:**
"firebase": "9.6.7",
**AngularFire:**
"@angular/fire": "7.2.1",
**System:**
NodeJS: v12.20.2
npm: 6.14.11
OS: macOS Monterey (12.2.1)
### How to reproduce these conditions
[Demo example](https://github.com/timkos/test-analytics) (fix firebase config in AppModule)
**Steps to set up and reproduce**
1. provide FirebaseApp and Analytics and add ScreenTrackingService to AppModule:
```
imports: [
BrowserModule,
AppRoutingModule,
provideFirebaseApp(() =>
initializeApp(config)
),
provideAnalytics(() => getAnalytics())
],
providers: [ScreenTrackingService] ```
2. Create two routes `/test` and `/test2`. The route `/test` we will visit and stay on it for a longer time. On the other hand, we will always go to `/test2` just for a short time and then always go back to `/test` route.
**Sample data and security rules**
### Debug output
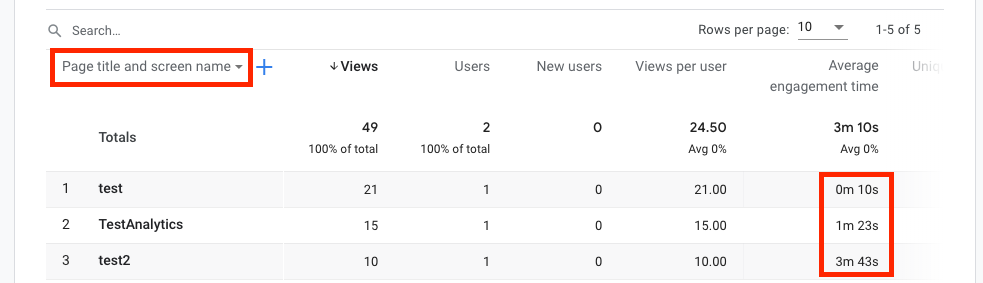
After some time we can see Average Engagement Times for visited paths (screens) on
Firebase -> Analytics -> Dashboard -> View pages and screens.
To see data for screen names (routes) switch from 'Page title and screen class' to 'Page title and screen name'.
### Expected behavior
Average Engagement Time of the route `/test` should be much bigger then the one of the `/test2` route.
### Actual behavior
Average Engagement Time of the route `/test` is much smaller then the one of `/test2` route.
It looks like previous engagement time is added to the next visited route (screen). It should be added to the previous route (screen).
コントリビューションガイド
調査の方向性
AppModule での ScreenTrackingService の登録から始め、リンク先のデモで説明されているとおりに /test と /test2 にアクセスして、ルートのシーケンスを再現します。Firebase Analytics の画面エンゲージメントの結果を、期待されるルートの帰属と比較します。より長く存続する /test ルートが /test2 よりも平均エンゲージメント時間を大幅に長く報告すれば完了です。
索引モデルが issue の本文から書いたものです。
評価
- 技術スタック
- angular, firebase, typescript
- 領域
- analytics, frontend
- issue の種類
- バグ
- 難易度
- 4/5
- 見積もり時間
- 3〜5日
- 活発さ
- 停滞
- 明瞭さ
- おおむね明確
- 初心者へのやさしさ
- 35/100