Analytics: When using ScreenTrackingService the average engagement time is calculated the wrong way
- Dominant language
- TypeScript
- Stars
- 7.8k
- Forks
- 2.2k
- Avg merge
- 22h 28m
- Merged PRs (30d)
- 6
Description
### Version info
**Angular:**
"@angular/animations": "13.1.3",
"@angular/common": "13.1.3",
"@angular/compiler": "13.1.3",
"@angular/core": "13.1.3",
"@angular/forms": "13.1.3",
"@angular/platform-browser": "13.1.3",
"@angular/platform-browser-dynamic": "13.1.3",
"@angular/router": "13.1.3",
"rxjs": "7.4.0",
"tslib": "2.3.1",
"zone.js": "0.11.4",
"typescript": "4.5.5"
**Firebase:**
"firebase": "9.6.7",
**AngularFire:**
"@angular/fire": "7.2.1",
**System:**
NodeJS: v12.20.2
npm: 6.14.11
OS: macOS Monterey (12.2.1)
### How to reproduce these conditions
[Demo example](https://github.com/timkos/test-analytics) (fix firebase config in AppModule)
**Steps to set up and reproduce**
1. provide FirebaseApp and Analytics and add ScreenTrackingService to AppModule:
```
imports: [
BrowserModule,
AppRoutingModule,
provideFirebaseApp(() =>
initializeApp(config)
),
provideAnalytics(() => getAnalytics())
],
providers: [ScreenTrackingService] ```
2. Create two routes `/test` and `/test2`. The route `/test` we will visit and stay on it for a longer time. On the other hand, we will always go to `/test2` just for a short time and then always go back to `/test` route.
**Sample data and security rules**
### Debug output
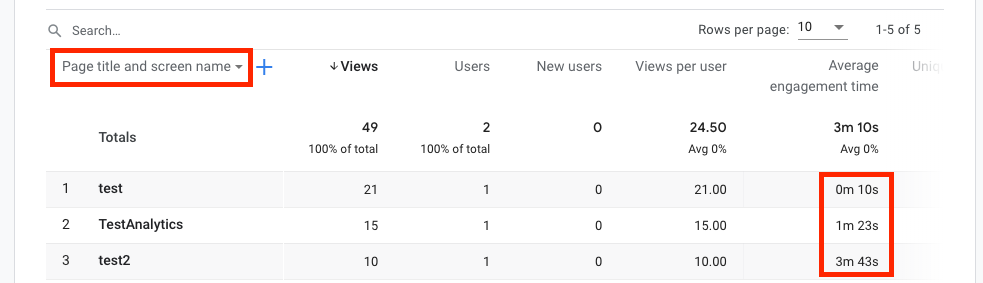
After some time we can see Average Engagement Times for visited paths (screens) on
Firebase -> Analytics -> Dashboard -> View pages and screens.
To see data for screen names (routes) switch from 'Page title and screen class' to 'Page title and screen name'.
### Expected behavior
Average Engagement Time of the route `/test` should be much bigger then the one of the `/test2` route.
### Actual behavior
Average Engagement Time of the route `/test` is much smaller then the one of `/test2` route.
It looks like previous engagement time is added to the next visited route (screen). It should be added to the previous route (screen).
Contributor guide
Research direction
Start at ScreenTrackingService registration in AppModule and reproduce the route sequence from the linked demo, visiting /test and /test2 as described. Compare the Firebase Analytics screen engagement results with the expected route attribution; done means the longer-lived /test route reports substantially greater average engagement time than /test2.
Written by the indexing model from the issue text.
Assessment
- Tech stack
- angular, firebase, typescript
- Domain
- analytics, frontend
- Issue type
- Bug
- Difficulty
- 4/5
- Estimated time
- 3-5 days
- Activity status
- Stale
- Clarity
- Mostly clear
- Newbie friendliness
- 35/100