DeployBoard / DeployBoard/deployboard-python
Add heatmap to analytics page
- Ngôn ngữ chính
- Python
- Star
- 10
- Fork
- 1
- Chỉ số merge pull request
- Không có pull request nào được merge trong 30 ngày
Mô tả
**Is your feature request related to a problem? Please describe.**
I would like to provide a heatmap of time of day, and day of week, of when deployments happen.
**Describe the solution you'd like**
Similar to GitHubs Contributions heatmap of month/day of week. Substitute the month on the top, for the hour of the day.
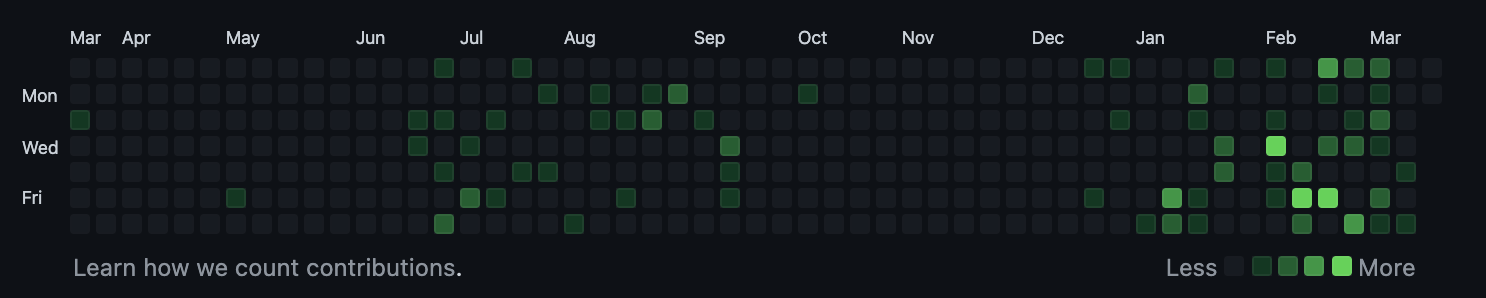
**Describe alternatives you've considered**
None yet.
**Additional context**
None.
Hướng dẫn đóng góp
Chưa lập chỉ mục được hướng dẫn đóng góp cho kho mã nguồn này
Hướng nghiên cứu
The issue names no files, tests, or entry points; start by locating the analytics page and the deployment data it uses. Define the heatmap's time-of-day and day-of-week behavior, then verify that the page displays deployment activity in a GitHub Contributions-style layout.
Do mô hình lập chỉ mục viết ra từ nội dung của issue.
Đánh giá
- Lĩnh vực
- analytics
- Loại issue
- Tính năng
- Độ khó
- 5/5
- Thời gian dự kiến
- Hơn một tuần
- Mức độ hoạt động
- Đình trệ
- Độ rõ ràng
- Cần làm rõ
- Mức phù hợp với người mới
- 25/100