DeployBoard / DeployBoard/deployboard-python
Add heatmap to analytics page
- Dominant language
- Python
- Stars
- 10
- Forks
- 1
- PR merge metrics
- No merged PRs in 30d
Description
**Is your feature request related to a problem? Please describe.**
I would like to provide a heatmap of time of day, and day of week, of when deployments happen.
**Describe the solution you'd like**
Similar to GitHubs Contributions heatmap of month/day of week. Substitute the month on the top, for the hour of the day.
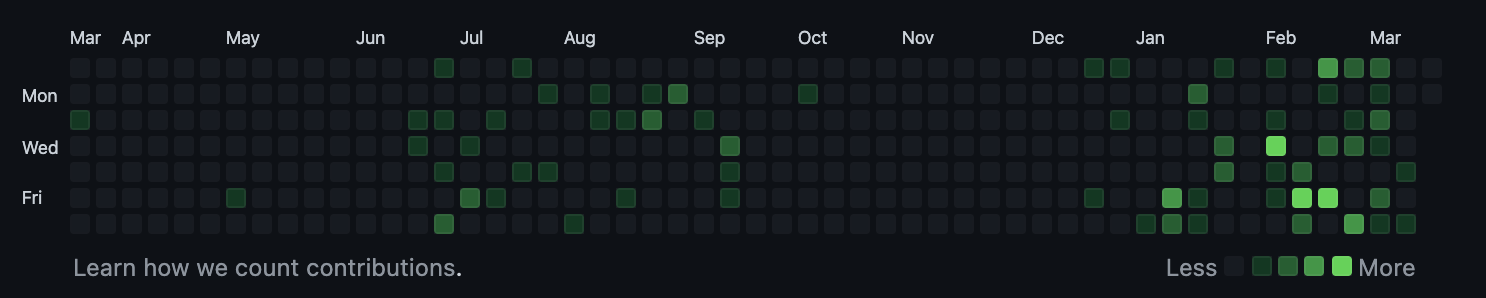
**Describe alternatives you've considered**
None yet.
**Additional context**
None.
Contributor guide
No contributing guide indexed for this repository
Research direction
The issue names no files, tests, or entry points; start by locating the analytics page and the deployment data it uses. Define the heatmap's time-of-day and day-of-week behavior, then verify that the page displays deployment activity in a GitHub Contributions-style layout.
Written by the indexing model from the issue text.
Assessment
- Domain
- analytics
- Issue type
- Feature
- Difficulty
- 5/5
- Estimated time
- Over a week
- Activity status
- Stale
- Clarity
- Needs clarification
- Newbie friendliness
- 25/100