DeployBoard / DeployBoard/deployboard-python
Add heatmap to analytics page
未关闭
enhancement
web
- 主要语言
- Python
- 星标
- 10
- 派生
- 1
- PR 合并指标
- 30 天内没有已合并 PR
描述
**Is your feature request related to a problem? Please describe.**
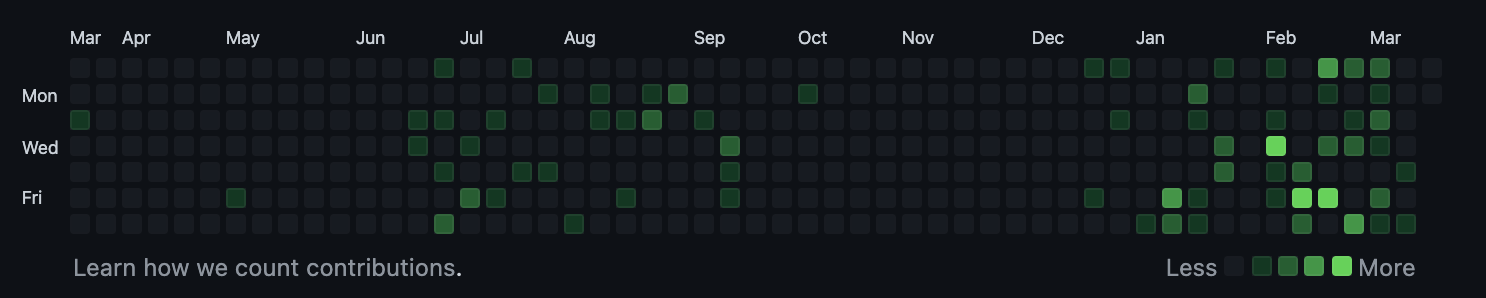
I would like to provide a heatmap of time of day, and day of week, of when deployments happen.
**Describe the solution you'd like**
Similar to GitHubs Contributions heatmap of month/day of week. Substitute the month on the top, for the hour of the day.
**Describe alternatives you've considered**
None yet.
**Additional context**
None.
贡献指南
这个仓库没有索引到贡献指南
评估
这个 Issue 还没有评估数据。