DeployBoard / DeployBoard/deployboard-python
Add heatmap to analytics page
未關閉
enhancement
web
- 主要語言
- Python
- 星號
- 10
- 分支
- 1
- PR 合併指標
- 30 天內沒有已合併 PR
描述
**Is your feature request related to a problem? Please describe.**
I would like to provide a heatmap of time of day, and day of week, of when deployments happen.
**Describe the solution you'd like**
Similar to GitHubs Contributions heatmap of month/day of week. Substitute the month on the top, for the hour of the day.
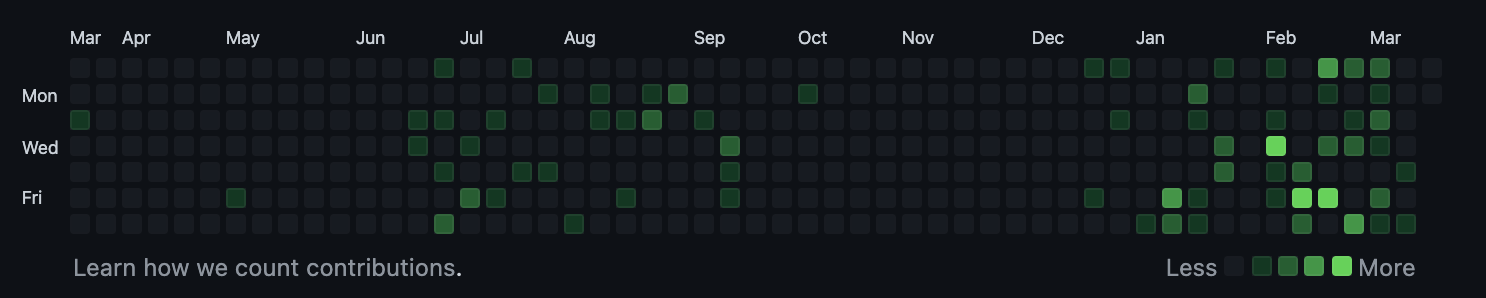
**Describe alternatives you've considered**
None yet.
**Additional context**
None.
貢獻指南
這個儲存庫沒有索引到貢獻指南
研究方向
該 issue 未指明任何檔案、測試或進入點;先定位 analytics 頁面及其使用的 deployment 資料。定義熱圖按一天中的時間和星期幾的行為,然後驗證頁面是否以 GitHub Contributions 風格的版面配置顯示 deployment 活動。
由索引模型根據 Issue 內容生成。
評估
- 領域
- analytics
- Issue 類型
- 功能
- 難度
- 5/5
- 預估耗時
- 一週以上
- 活躍度
- 停滯
- 描述清晰度
- 需要釐清
- 新手友好度
- 25/100