DeployBoard / DeployBoard/deployboard-python
Add heatmap to analytics page
オープン
enhancement
web
- 主要言語
- Python
- スター
- 10
- フォーク
- 1
- PR マージ指標
- 30日以内にマージされた PR はありません
説明
**Is your feature request related to a problem? Please describe.**
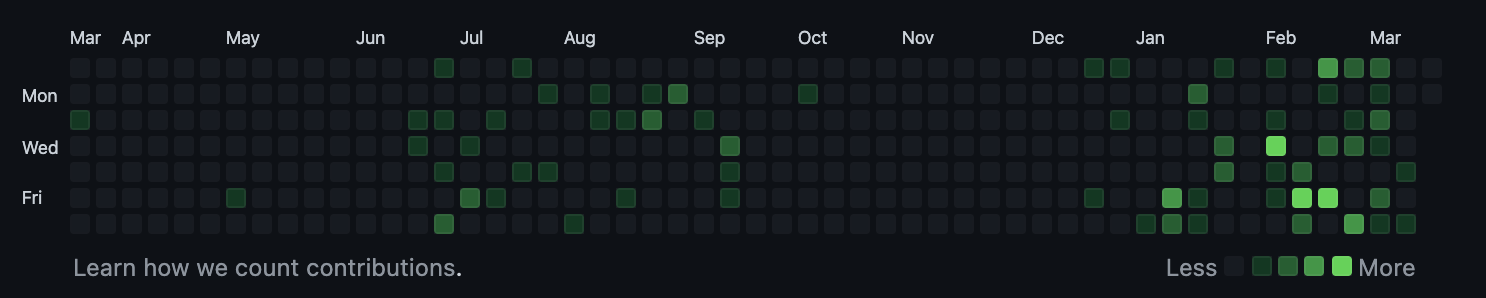
I would like to provide a heatmap of time of day, and day of week, of when deployments happen.
**Describe the solution you'd like**
Similar to GitHubs Contributions heatmap of month/day of week. Substitute the month on the top, for the hour of the day.
**Describe alternatives you've considered**
None yet.
**Additional context**
None.
コントリビューションガイド
このリポジトリのコントリビューションガイドは索引されていません
評価
この issue はまだ評価されていません。