Bug report: Incorrect drawing order of Isosurfaces with opacity
Chưa có ai nhận issue này.
- Ngôn ngữ chính
- Python
- Star
- 18.8k
- Fork
- 2.8k
- Merge trung bình
- 16 giờ 26 phút
- Pull request đã merge (30 ngày)
- 21
Mô tả
- Reported by Łukasz as a post on the forum
- Plotly version: 6.2.0
- Python version: 3.11.13
- Browser: chrome
Hi, i have found quite annoying bug which can be seen only when the isosurface components are opaque. I observed that it doesn’t only occur for multiple trace isosurfaces, but also single multisurface isosurfaces and volume plots.
Here is an example code how to replicate it:
(The fun part is that when you change the opacity from 0.99 to 1 the plot gets visualised properly.)
import plotly.graph_objects as go
import numpy as np
import nrrd
from skimage.transform import resize


volume = np.zeros((50, 50, 50))
volume[1:10, 5:45, 5:45] =1
volume[10:20, 5:45, 5:45] = 1.5
volume[20:30, 5:45, 5:45] = 2
volume[30:40, 5:45, 5:45] = 2.5
volume[40:49, 5:45, 5:45] = 3
Z, X, Y = np.mgrid[0:volume.shape[0]:1, 0:volume.shape[1]:1, 0:volume.shape[2]:1]


fig = go.Figure(data=[go.Isosurface(
    x=X.flatten(),
    y=Y.flatten(),
    z=Z.flatten(),
    opacity=0.99,
    value=np.where(volume == 1, 1, 0).flatten(),
    surface_fill=1,
    surface_count=1,
    colorscale=[[0, 'rgb(0,255,0)'], [1, 'rgb(0,255,0)']],
    caps=dict(x_show=False, y_show=False, z_show=False),
    #slices_z=dict(show=True, locations=list(range(volume.shape[0]))),
    ),
    go.Isosurface(
        x=X.flatten(),
        y=Y.flatten(),
        z=Z.flatten(),
        opacity=0.99,
        value=np.where(volume == 3, 1, 0).flatten(),
        surface_fill=1,
        surface_count=1,
        colorscale=[[0, 'rgb(255,0,0)'], [1, 'rgb(255,0,0)']],
        caps=dict(x_show=False, y_show=False, z_show=False),
        # slices_z=dict(show=True, locations=list(range(volume.shape[0]))),
    )])
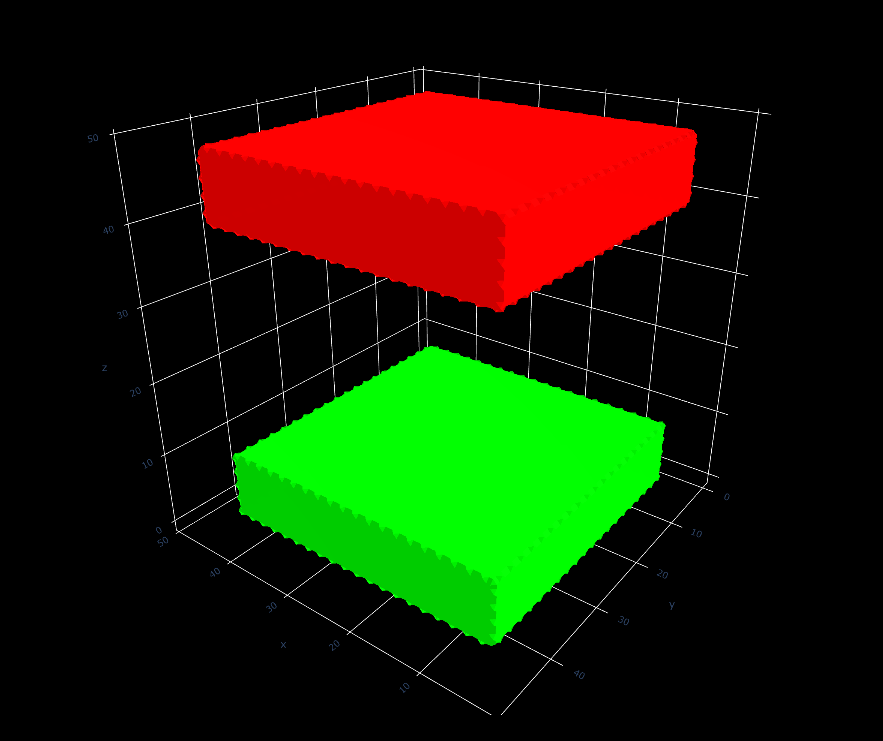
The bug can be seen looking form under the plot:

Hướng dẫn đóng góp
Bắt đầu từ đâu
- Đọc hết issue, rồi đọc hướng dẫn đóng góp của dự án.
- Bình luận trên issue rằng bạn sẽ nhận — tránh hai người làm cùng một việc.
- Fork repository và làm thay đổi trên một nhánh.
- Mở pull request có tham chiếu số hiệu của issue.
Hướng nghiên cứu
Bắt đầu bằng cách chạy bản tái hiện Python được cung cấp trong Chrome và so sánh isosurface với volume rendering ở độ mờ 0.99 và 1. Điều tra đường dẫn kết xuất cho các Isosurfaces, multisurfaces và volume plots đục và gần như đục. Hoàn tất có nghĩa là các trường hợp được cung cấp được vẽ theo đúng thứ tự mà không gây hồi quy cho kết xuất hoàn toàn đục.
Do mô hình lập chỉ mục viết ra từ nội dung của issue.
Đánh giá
- Công nghệ
- python
- Lĩnh vực
- data-visualization
- Loại issue
- Lỗi
- Độ khó
- 4/5
- Thời gian dự kiến
- 3-5 ngày
- Mức độ hoạt động
- Đình trệ
- Độ rõ ràng
- Khá rõ ràng
- Mức phù hợp với người mới
- 38/100