Bug report: Incorrect drawing order of Isosurfaces with opacity
Dieses Issue hat noch niemand übernommen.
- Vorherrschende Sprache
- Python
- Sterne
- 18.8k
- Forks
- 2.8k
- Ø Merge
- 16 Std. 26 Min.
- Gemergte PRs (30 T.)
- 21
Beschreibung
- Reported by Łukasz as a post on the forum
- Plotly version: 6.2.0
- Python version: 3.11.13
- Browser: chrome
Hi, i have found quite annoying bug which can be seen only when the isosurface components are opaque. I observed that it doesn’t only occur for multiple trace isosurfaces, but also single multisurface isosurfaces and volume plots.
Here is an example code how to replicate it:
(The fun part is that when you change the opacity from 0.99 to 1 the plot gets visualised properly.)
import plotly.graph_objects as go
import numpy as np
import nrrd
from skimage.transform import resize


volume = np.zeros((50, 50, 50))
volume[1:10, 5:45, 5:45] =1
volume[10:20, 5:45, 5:45] = 1.5
volume[20:30, 5:45, 5:45] = 2
volume[30:40, 5:45, 5:45] = 2.5
volume[40:49, 5:45, 5:45] = 3
Z, X, Y = np.mgrid[0:volume.shape[0]:1, 0:volume.shape[1]:1, 0:volume.shape[2]:1]


fig = go.Figure(data=[go.Isosurface(
    x=X.flatten(),
    y=Y.flatten(),
    z=Z.flatten(),
    opacity=0.99,
    value=np.where(volume == 1, 1, 0).flatten(),
    surface_fill=1,
    surface_count=1,
    colorscale=[[0, 'rgb(0,255,0)'], [1, 'rgb(0,255,0)']],
    caps=dict(x_show=False, y_show=False, z_show=False),
    #slices_z=dict(show=True, locations=list(range(volume.shape[0]))),
    ),
    go.Isosurface(
        x=X.flatten(),
        y=Y.flatten(),
        z=Z.flatten(),
        opacity=0.99,
        value=np.where(volume == 3, 1, 0).flatten(),
        surface_fill=1,
        surface_count=1,
        colorscale=[[0, 'rgb(255,0,0)'], [1, 'rgb(255,0,0)']],
        caps=dict(x_show=False, y_show=False, z_show=False),
        # slices_z=dict(show=True, locations=list(range(volume.shape[0]))),
    )])
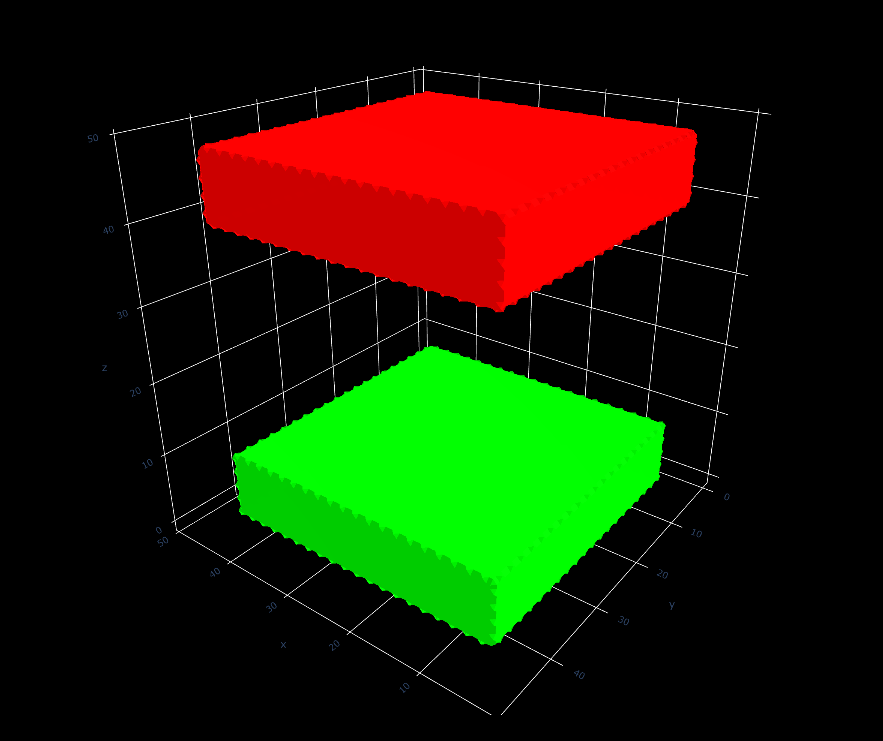
The bug can be seen looking form under the plot:

Beitragsleitfaden
Erste Schritte
- Lies das ganze Issue und danach den Beitragsleitfaden des Projekts.
- Schreib ins Issue, dass du es übernimmst — das erspart doppelte Arbeit.
- Forke das Repository und arbeite in einem Branch.
- Öffne einen Pull Request, der die Issue-Nummer nennt.
Rechercherichtung
Beginnen Sie damit, die bereitgestellte Python-Reproduktion in Chrome auszuführen und isosurface und volume rendering bei einer Opazität von 0.99 gegenüber 1 zu vergleichen. Untersuchen Sie den Rendering-Pfad für opake und nahezu opake Isosurfaces, multisurfaces und volume plots. Als erledigt gilt die Aufgabe, wenn die bereitgestellten Fälle in der richtigen Reihenfolge gezeichnet werden, ohne das vollständig opake Rendering zu beeinträchtigen.
Vom Indexierungsmodell aus dem Issue-Text verfasst.
Bewertung
- Tech-Stack
- python
- Bereich
- data-visualization
- Issue-Typ
- Bug
- Schwierigkeit
- 4/5
- Geschätzter Aufwand
- 3-5 Tage
- Aktivitätsstatus
- Veraltet
- Klarheit
- Größtenteils klar
- Anfängerfreundlichkeit
- 38/100