Bug report: Incorrect drawing order of Isosurfaces with opacity
未关闭
还没有人认领这个 Issue。
bug
P2
- 主要语言
- Python
- 星标
- 18.8k
- 派生
- 2.8k
- 平均合并
- 16 小时 26 分钟
- 30 天内合并 PR
- 21
描述
- Reported by Łukasz as a post on the forum
- Plotly version: 6.2.0
- Python version: 3.11.13
- Browser: chrome
Hi, i have found quite annoying bug which can be seen only when the isosurface components are opaque. I observed that it doesn’t only occur for multiple trace isosurfaces, but also single multisurface isosurfaces and volume plots.
Here is an example code how to replicate it:
(The fun part is that when you change the opacity from 0.99 to 1 the plot gets visualised properly.)
import plotly.graph_objects as go
import numpy as np
import nrrd
from skimage.transform import resize


volume = np.zeros((50, 50, 50))
volume[1:10, 5:45, 5:45] =1
volume[10:20, 5:45, 5:45] = 1.5
volume[20:30, 5:45, 5:45] = 2
volume[30:40, 5:45, 5:45] = 2.5
volume[40:49, 5:45, 5:45] = 3
Z, X, Y = np.mgrid[0:volume.shape[0]:1, 0:volume.shape[1]:1, 0:volume.shape[2]:1]


fig = go.Figure(data=[go.Isosurface(
    x=X.flatten(),
    y=Y.flatten(),
    z=Z.flatten(),
    opacity=0.99,
    value=np.where(volume == 1, 1, 0).flatten(),
    surface_fill=1,
    surface_count=1,
    colorscale=[[0, 'rgb(0,255,0)'], [1, 'rgb(0,255,0)']],
    caps=dict(x_show=False, y_show=False, z_show=False),
    #slices_z=dict(show=True, locations=list(range(volume.shape[0]))),
    ),
    go.Isosurface(
        x=X.flatten(),
        y=Y.flatten(),
        z=Z.flatten(),
        opacity=0.99,
        value=np.where(volume == 3, 1, 0).flatten(),
        surface_fill=1,
        surface_count=1,
        colorscale=[[0, 'rgb(255,0,0)'], [1, 'rgb(255,0,0)']],
        caps=dict(x_show=False, y_show=False, z_show=False),
        # slices_z=dict(show=True, locations=list(range(volume.shape[0]))),
    )])
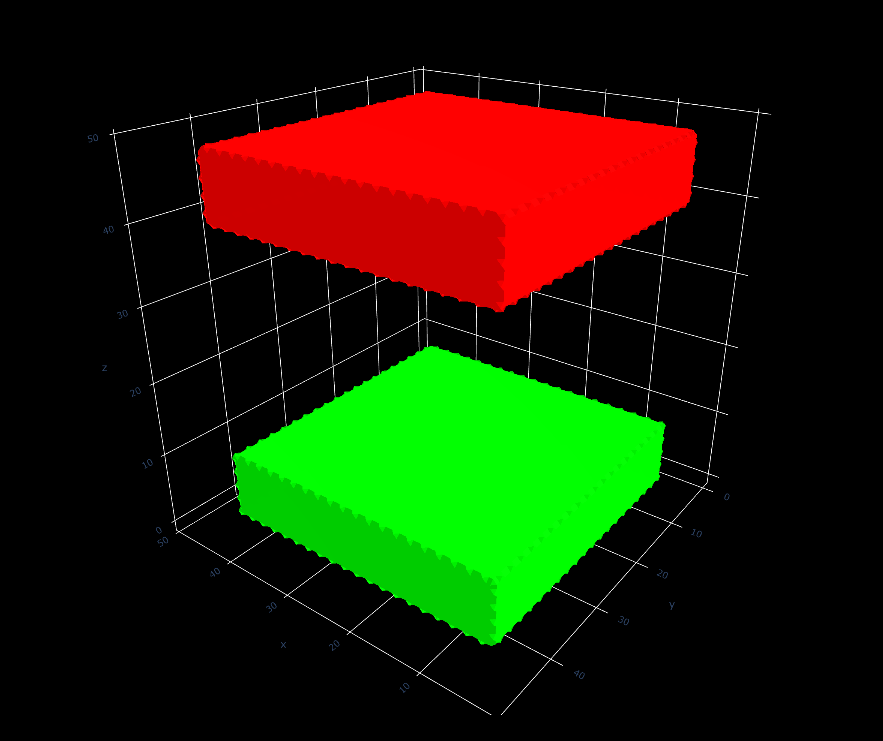
The bug can be seen looking form under the plot:

贡献指南
从这里开始
- 先读完整个 Issue,再读项目的贡献指南。
- 在 Issue 下留言说明你要接手 —— 这能避免两个人做同样的事。
- Fork 仓库,在一个分支上完成修改。
- 提交 Pull Request,并在描述里引用这个 Issue 编号。
调研方向
首先在 Chrome 中运行提供的 Python 重现代码,并比较不透明度为 0.99 和 1 时的 isosurface 与 volume rendering。调查不透明和近乎不透明的 Isosurfaces、multisurfaces 及 volume plots 的渲染路径。当提供的案例按正确顺序绘制,且不会导致完全不透明渲染发生回归时,即视为完成。
由索引模型根据 Issue 内容生成。
评估
- 技术栈
- python
- 领域
- data-visualization
- Issue 类型
- 缺陷
- 难度
- 4/5
- 预计耗时
- 3-5 天
- 活跃度
- 停滞
- 描述清晰度
- 基本清楚
- 新手友好度
- 38/100