go.Table creates an unsightly and non-removable scroll bar when plotting on another figure.
Chưa có ai nhận issue này.
- Ngôn ngữ chính
- Python
- Star
- 18.8k
- Fork
- 2.8k
- Merge trung bình
- 16 giờ 26 phút
- Pull request đã merge (30 ngày)
- 21
Mô tả
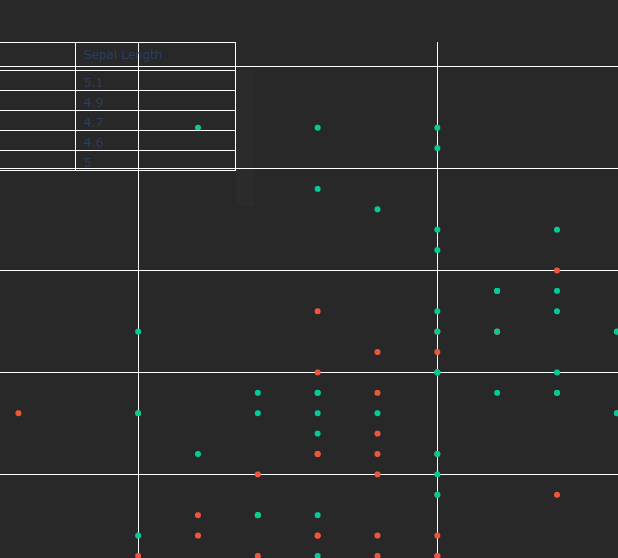
When adding a small go.Table trace to a go.Figure object, the renderer creates a scrollbar which cannot be removed or hidden. This scrollbar is of low opacity, but is nonetheless noticable and ruins the professionalism of a graph upon which it is drawn. This is particularly apparent on dark backgrounds, and makes it impractical to place a go.Table in, for example, the upper left corner of a figure for displaying of additional information. Reproducible example and screenshot are provided.
import plotly.express as px
import plotly.graph_objects as go

# Load example dataset
df = px.data.iris()

# Create scatter plot
fig = px.scatter(df, x="sepal_width", y="sepal_length", color="species")

# Set plot background color
fig.update_layout(
    plot_bgcolor="rgb(40, 40, 40)",
    paper_bgcolor="rgb(40, 40, 40)",
)

# Create table trace
table_trace = go.Table(
    header=dict(
        values=["Species", "Sepal Width", "Sepal Length"],
        fill_color="rgba(0,0,0,0)",
        align="left",
    ),
    cells=dict(
        values=[
            df.species[:5],
            df.sepal_width[:5],
            df.sepal_length[:5],
        ],
        fill_color="rgba(0,0,0,0)",
        align="left",
    ),
)

# Add table trace to the top left third of the plot area
fig.add_trace(
    table_trace
)
fig.update_traces(
    selector=dict(type='table'),
    domain=dict(x=[0., 0.3], y=[0.8, 1])
)

# Show plot
fig.show()
Hướng dẫn đóng góp
Bắt đầu từ đâu
- Đọc hết issue, rồi đọc hướng dẫn đóng góp của dự án.
- Bình luận trên issue rằng bạn sẽ nhận — tránh hai người làm cùng một việc.
- Fork repository và làm thay đổi trên một nhánh.
- Mở pull request có tham chiếu số hiệu của issue.
Hướng nghiên cứu
Bắt đầu bằng cách chạy bản tái hiện Python được cung cấp trong plotly.py và kiểm tra cách renderer xử lý một trace go.Table được đặt bên trong một figure khác. So sánh kết quả với ảnh chụp màn hình, sau đó xác minh rằng bảng có thể chiếm domain được chỉ định mà không hiển thị thanh cuộn không mong muốn và có thể nhìn thấy.
Do mô hình lập chỉ mục viết ra từ nội dung của issue.
Đánh giá
- Công nghệ
- python
- Lĩnh vực
- data-visualization
- Loại issue
- Lỗi
- Độ khó
- 4/5
- Thời gian dự kiến
- 3-5 ngày
- Mức độ hoạt động
- Đình trệ
- Độ rõ ràng
- Khá rõ ràng
- Mức phù hợp với người mới
- 35/100