go.Table creates an unsightly and non-removable scroll bar when plotting on another figure.
未關閉
還沒有人認領這個 Issue。
bug
P3
- 主要語言
- Python
- 星號
- 18.8k
- 分支
- 2.8k
- 平均合併
- 16 小時 26 分鐘
- 30 天內合併 PR
- 21
描述
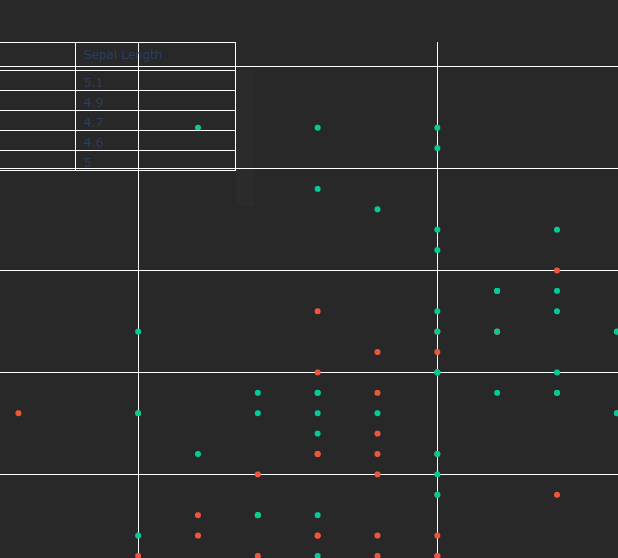
When adding a small go.Table trace to a go.Figure object, the renderer creates a scrollbar which cannot be removed or hidden. This scrollbar is of low opacity, but is nonetheless noticable and ruins the professionalism of a graph upon which it is drawn. This is particularly apparent on dark backgrounds, and makes it impractical to place a go.Table in, for example, the upper left corner of a figure for displaying of additional information. Reproducible example and screenshot are provided.
import plotly.express as px
import plotly.graph_objects as go

# Load example dataset
df = px.data.iris()

# Create scatter plot
fig = px.scatter(df, x="sepal_width", y="sepal_length", color="species")

# Set plot background color
fig.update_layout(
    plot_bgcolor="rgb(40, 40, 40)",
    paper_bgcolor="rgb(40, 40, 40)",
)

# Create table trace
table_trace = go.Table(
    header=dict(
        values=["Species", "Sepal Width", "Sepal Length"],
        fill_color="rgba(0,0,0,0)",
        align="left",
    ),
    cells=dict(
        values=[
            df.species[:5],
            df.sepal_width[:5],
            df.sepal_length[:5],
        ],
        fill_color="rgba(0,0,0,0)",
        align="left",
    ),
)

# Add table trace to the top left third of the plot area
fig.add_trace(
    table_trace
)
fig.update_traces(
    selector=dict(type='table'),
    domain=dict(x=[0., 0.3], y=[0.8, 1])
)

# Show plot
fig.show()
貢獻指南
從這裡開始
- 先讀完整個 Issue,再讀專案的貢獻指南。
- 在 Issue 下留言說明你要接手 —— 這能避免兩個人做同樣的事。
- Fork 儲存庫,在一個分支上完成修改。
- 送出 Pull Request,並在描述裡引用這個 Issue 編號。
研究方向
首先執行 plotly.py 中提供的 Python 重現程式碼,並檢查 renderer 如何處理放置在另一個 figure 內的 go.Table trace。將結果與螢幕截圖進行比較,然後驗證表格能夠佔據指定的 domain,且不會顯示可見的、不需要的捲軸。
由索引模型根據 Issue 內容生成。
評估
- 技術堆疊
- python
- 領域
- data-visualization
- Issue 類型
- 缺陷
- 難度
- 4/5
- 預估耗時
- 3-5 天
- 活躍度
- 停滯
- 描述清晰度
- 基本清楚
- 新手友好度
- 35/100