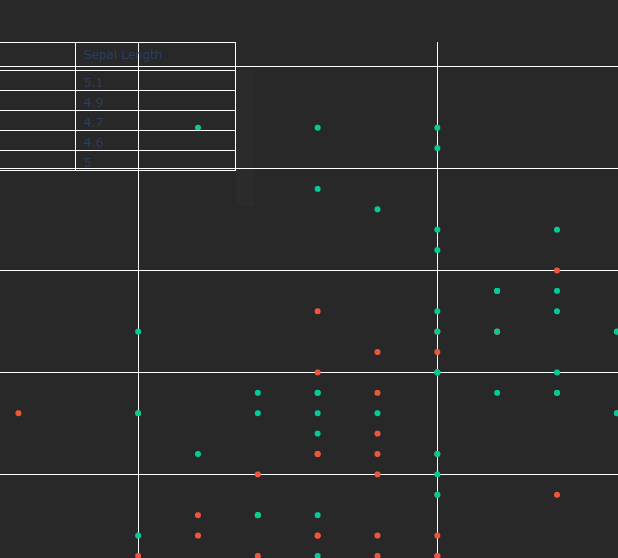
go.Table creates an unsightly and non-removable scroll bar when plotting on another figure.
Ninguém assumiu esta issue ainda.
- Linguagem predominante
- Python
- Estrelas
- 18.8k
- Forks
- 2.8k
- Merge médio
- 16h 26min
- PRs com merge (30d)
- 21
Descrição
When adding a small go.Table trace to a go.Figure object, the renderer creates a scrollbar which cannot be removed or hidden. This scrollbar is of low opacity, but is nonetheless noticable and ruins the professionalism of a graph upon which it is drawn. This is particularly apparent on dark backgrounds, and makes it impractical to place a go.Table in, for example, the upper left corner of a figure for displaying of additional information. Reproducible example and screenshot are provided.
import plotly.express as px
import plotly.graph_objects as go

# Load example dataset
df = px.data.iris()

# Create scatter plot
fig = px.scatter(df, x="sepal_width", y="sepal_length", color="species")

# Set plot background color
fig.update_layout(
    plot_bgcolor="rgb(40, 40, 40)",
    paper_bgcolor="rgb(40, 40, 40)",
)

# Create table trace
table_trace = go.Table(
    header=dict(
        values=["Species", "Sepal Width", "Sepal Length"],
        fill_color="rgba(0,0,0,0)",
        align="left",
    ),
    cells=dict(
        values=[
            df.species[:5],
            df.sepal_width[:5],
            df.sepal_length[:5],
        ],
        fill_color="rgba(0,0,0,0)",
        align="left",
    ),
)

# Add table trace to the top left third of the plot area
fig.add_trace(
    table_trace
)
fig.update_traces(
    selector=dict(type='table'),
    domain=dict(x=[0., 0.3], y=[0.8, 1])
)

# Show plot
fig.show()
Guia de contribuição
Primeiros passos
- Leia a issue inteira e depois o guia de contribuição do projeto.
- Comente na issue dizendo que vai assumir — evita que duas pessoas façam o mesmo trabalho.
- Faça um fork do repositório e trabalhe em uma branch.
- Abra um pull request que referencie o número da issue.
Direção de pesquisa
Comece executando a reprodução em Python fornecida em plotly.py e inspecione como o renderer lida com um trace go.Table posicionado dentro de outra figura. Compare o resultado com a captura de tela e, em seguida, verifique se a tabela pode ocupar o domain especificado sem exibir uma barra de rolagem visível e indesejada.
Escrita pelo modelo de indexação a partir do texto da issue.
Avaliação
- Stack de tecnologia
- python
- Domínio
- data-visualization
- Tipo de issue
- Bug
- Dificuldade
- 4/5
- Tempo estimado
- 3-5 dias
- Status de atividade
- Estagnada
- Clareza
- Razoavelmente clara
- Facilidade para iniciantes
- 35/100