go.Table creates an unsightly and non-removable scroll bar when plotting on another figure.
Dieses Issue hat noch niemand übernommen.
- Vorherrschende Sprache
- Python
- Sterne
- 18.8k
- Forks
- 2.8k
- Ø Merge
- 16 Std. 26 Min.
- Gemergte PRs (30 T.)
- 21
Beschreibung
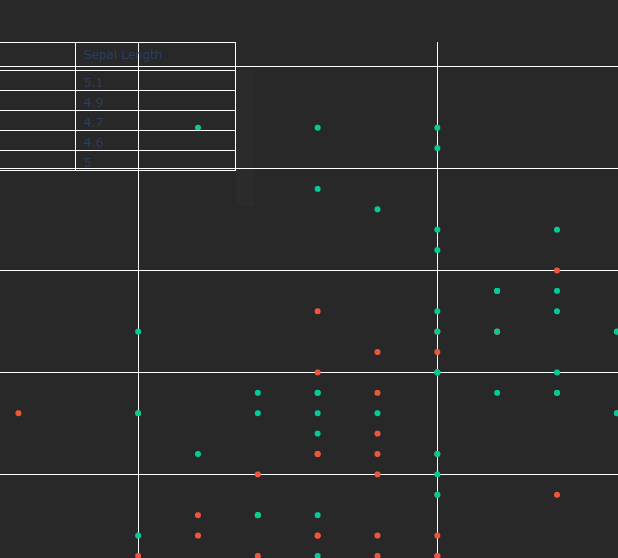
When adding a small go.Table trace to a go.Figure object, the renderer creates a scrollbar which cannot be removed or hidden. This scrollbar is of low opacity, but is nonetheless noticable and ruins the professionalism of a graph upon which it is drawn. This is particularly apparent on dark backgrounds, and makes it impractical to place a go.Table in, for example, the upper left corner of a figure for displaying of additional information. Reproducible example and screenshot are provided.
import plotly.express as px
import plotly.graph_objects as go

# Load example dataset
df = px.data.iris()

# Create scatter plot
fig = px.scatter(df, x="sepal_width", y="sepal_length", color="species")

# Set plot background color
fig.update_layout(
    plot_bgcolor="rgb(40, 40, 40)",
    paper_bgcolor="rgb(40, 40, 40)",
)

# Create table trace
table_trace = go.Table(
    header=dict(
        values=["Species", "Sepal Width", "Sepal Length"],
        fill_color="rgba(0,0,0,0)",
        align="left",
    ),
    cells=dict(
        values=[
            df.species[:5],
            df.sepal_width[:5],
            df.sepal_length[:5],
        ],
        fill_color="rgba(0,0,0,0)",
        align="left",
    ),
)

# Add table trace to the top left third of the plot area
fig.add_trace(
    table_trace
)
fig.update_traces(
    selector=dict(type='table'),
    domain=dict(x=[0., 0.3], y=[0.8, 1])
)

# Show plot
fig.show()
Beitragsleitfaden
Erste Schritte
- Lies das ganze Issue und danach den Beitragsleitfaden des Projekts.
- Schreib ins Issue, dass du es übernimmst — das erspart doppelte Arbeit.
- Forke das Repository und arbeite in einem Branch.
- Öffne einen Pull Request, der die Issue-Nummer nennt.
Rechercherichtung
Führe zunächst die bereitgestellte Python-Reproduktion in plotly.py aus und untersuche, wie der Renderer einen go.Table-Trace verarbeitet, der innerhalb einer anderen Figure positioniert ist. Vergleiche das Ergebnis mit dem Screenshot und überprüfe anschließend, dass die Tabelle die angegebene domain einnehmen kann, ohne eine sichtbare, unerwünschte Bildlaufleiste anzuzeigen.
Vom Indexierungsmodell aus dem Issue-Text verfasst.
Bewertung
- Tech-Stack
- python
- Bereich
- data-visualization
- Issue-Typ
- Bug
- Schwierigkeit
- 4/5
- Geschätzter Aufwand
- 3-5 Tage
- Aktivitätsstatus
- Veraltet
- Klarheit
- Größtenteils klar
- Anfängerfreundlichkeit
- 35/100