add_vline not rendering properly with secondary y-axis
未關閉
還沒有人認領這個 Issue。
bug
P3
- 主要語言
- Python
- 星號
- 18.8k
- 分支
- 2.8k
- 平均合併
- 16 小時 26 分鐘
- 30 天內合併 PR
- 21
描述
Hello,
I encountered a problem, when using add_vline with a secondary y-axis and no data on it.
plotly.py version: 5.5.0
Minimum example:
import plotly.graph_objects as go
from plotly.subplots import make_subplots

fig = make_subplots(
    specs=[[{"secondary_y": True}]],
)

# Uncomment the line below to "fix" the problem
# fig.add_trace(go.Scatter(x=[0, 1], y=[2, 3]), secondary_y=False)
fig.add_trace(go.Scatter(x=[4, 5], y=[6, 10]), secondary_y=True)
# Change secondary_y to True to also "fix" the problem
fig.add_vline(4.5, exclude_empty_subplots=False, secondary_y=False)
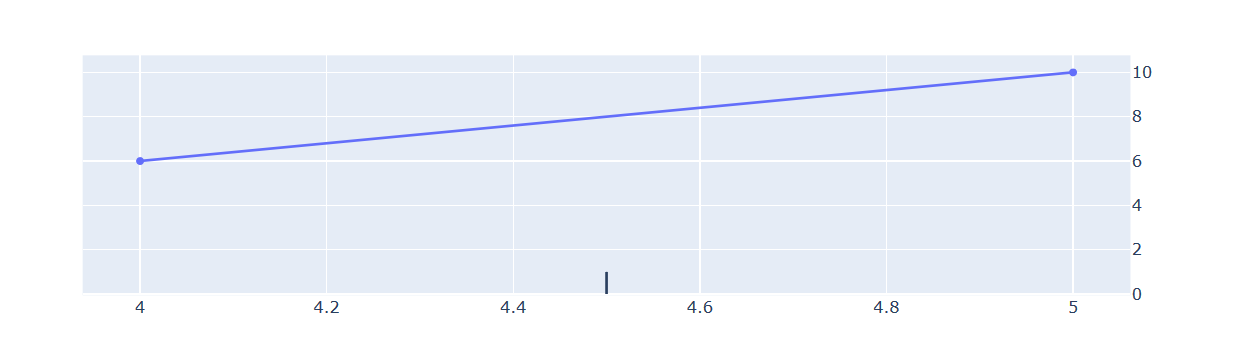
Expected behavior:
The add_vline should a vertical line to the plot no matter if it has traces or not. How the plot looks like, when following the second comment.
Best regards
Julian
貢獻指南
從這裡開始
- 先讀完整個 Issue,再讀專案的貢獻指南。
- 在 Issue 下留言說明你要接手 —— 這能避免兩個人做同樣的事。
- Fork 儲存庫,在一個分支上完成修改。
- 送出 Pull Request,並在描述裡引用這個 Issue 編號。
研究方向
先使用 plotly.py 5.5.0 執行 issue 中的最小範例,並檢查主要座標軸沒有資料時 add_vline 的行為。將結果與註解掉的 trace 以及 secondary_y=True 的情況進行比較;當垂直線即使在所要求的座標軸沒有 trace 時也能渲染到該座標軸上,就表示完成。
由索引模型根據 Issue 內容生成。
評估
- 技術堆疊
- python
- 領域
- data-visualization
- Issue 類型
- 缺陷
- 難度
- 3/5
- 預估耗時
- 1-2 天
- 活躍度
- 停滯
- 描述清晰度
- 基本清楚
- 新手友好度
- 45/100