add_vline not rendering properly with secondary y-axis
未关闭
还没有人认领这个 Issue。
bug
P3
- 主要语言
- Python
- 星标
- 18.8k
- 派生
- 2.8k
- 平均合并
- 16 小时 26 分钟
- 30 天内合并 PR
- 21
描述
Hello,
I encountered a problem, when using add_vline with a secondary y-axis and no data on it.
plotly.py version: 5.5.0
Minimum example:
import plotly.graph_objects as go
from plotly.subplots import make_subplots

fig = make_subplots(
    specs=[[{"secondary_y": True}]],
)

# Uncomment the line below to "fix" the problem
# fig.add_trace(go.Scatter(x=[0, 1], y=[2, 3]), secondary_y=False)
fig.add_trace(go.Scatter(x=[4, 5], y=[6, 10]), secondary_y=True)
# Change secondary_y to True to also "fix" the problem
fig.add_vline(4.5, exclude_empty_subplots=False, secondary_y=False)
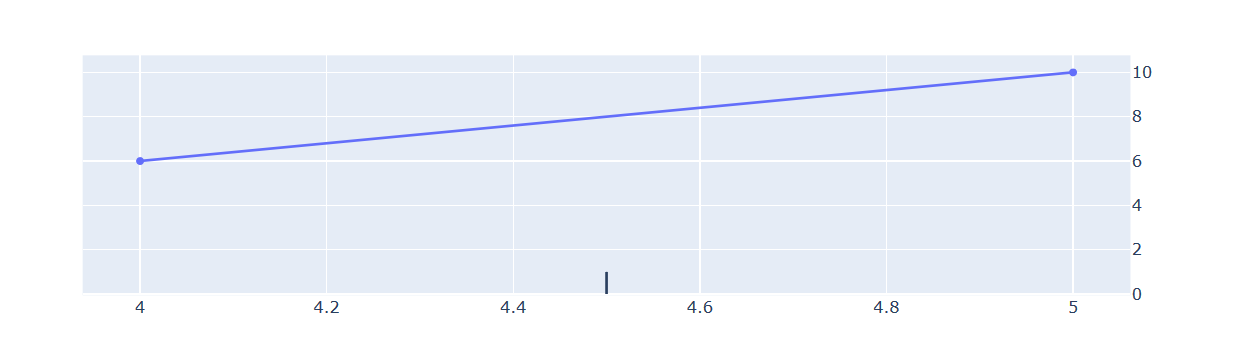
Expected behavior:
The add_vline should a vertical line to the plot no matter if it has traces or not. How the plot looks like, when following the second comment.
Best regards
Julian
贡献指南
从这里开始
- 先读完整个 Issue,再读项目的贡献指南。
- 在 Issue 下留言说明你要接手 —— 这能避免两个人做同样的事。
- Fork 仓库,在一个分支上完成修改。
- 提交 Pull Request,并在描述里引用这个 Issue 编号。
调研方向
首先使用 plotly.py 5.5.0 运行 issue 中的最小示例,并检查主坐标轴没有数据时 add_vline 的行为。将结果与注释掉的 trace 以及 secondary_y=True 的情况进行比较;当垂直线即使在所请求的坐标轴没有 trace 时也能渲染到该坐标轴上时,即表示完成。
由索引模型根据 Issue 内容生成。
评估
- 技术栈
- python
- 领域
- data-visualization
- Issue 类型
- 缺陷
- 难度
- 3/5
- 预计耗时
- 1-2 天
- 活跃度
- 停滞
- 描述清晰度
- 基本清楚
- 新手友好度
- 45/100