add_vline not rendering properly with secondary y-axis
Dieses Issue hat noch niemand übernommen.
- Vorherrschende Sprache
- Python
- Sterne
- 18.8k
- Forks
- 2.8k
- Ø Merge
- 16 Std. 26 Min.
- Gemergte PRs (30 T.)
- 21
Beschreibung
Hello,
I encountered a problem, when using add_vline with a secondary y-axis and no data on it.
plotly.py version: 5.5.0
Minimum example:
import plotly.graph_objects as go
from plotly.subplots import make_subplots

fig = make_subplots(
    specs=[[{"secondary_y": True}]],
)

# Uncomment the line below to "fix" the problem
# fig.add_trace(go.Scatter(x=[0, 1], y=[2, 3]), secondary_y=False)
fig.add_trace(go.Scatter(x=[4, 5], y=[6, 10]), secondary_y=True)
# Change secondary_y to True to also "fix" the problem
fig.add_vline(4.5, exclude_empty_subplots=False, secondary_y=False)
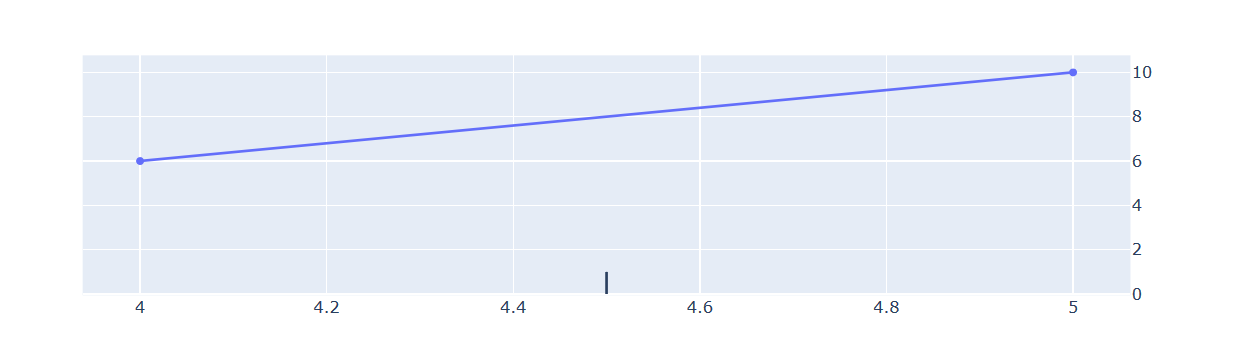
Expected behavior:
The add_vline should a vertical line to the plot no matter if it has traces or not. How the plot looks like, when following the second comment.
Best regards
Julian
Beitragsleitfaden
Erste Schritte
- Lies das ganze Issue und danach den Beitragsleitfaden des Projekts.
- Schreib ins Issue, dass du es übernimmst — das erspart doppelte Arbeit.
- Forke das Repository und arbeite in einem Branch.
- Öffne einen Pull Request, der die Issue-Nummer nennt.
Rechercherichtung
Führen Sie zunächst das minimale Beispiel im Issue mit plotly.py 5.5.0 aus und untersuchen Sie das Verhalten von add_vline, wenn die primäre Achse keine Daten enthält. Vergleichen Sie das Ergebnis mit dem auskommentierten Trace und den Fällen mit secondary_y=True; fertig ist die Aufgabe, wenn die vertikale Linie auf der angeforderten Achse gerendert wird, auch wenn diese Achse keine Traces enthält.
Vom Indexierungsmodell aus dem Issue-Text verfasst.
Bewertung
- Tech-Stack
- python
- Bereich
- data-visualization
- Issue-Typ
- Bug
- Schwierigkeit
- 3/5
- Geschätzter Aufwand
- 1-2 Tage
- Aktivitätsstatus
- Veraltet
- Klarheit
- Größtenteils klar
- Anfängerfreundlichkeit
- 45/100