add_layout_image doesn't work with secondary_y
Đang mở
Chưa có ai nhận issue này.
bug
P3
- Ngôn ngữ chính
- Python
- Star
- 18.8k
- Fork
- 2.8k
- Merge trung bình
- 16 giờ 26 phút
- Pull request đã merge (30 ngày)
- 21
Mô tả
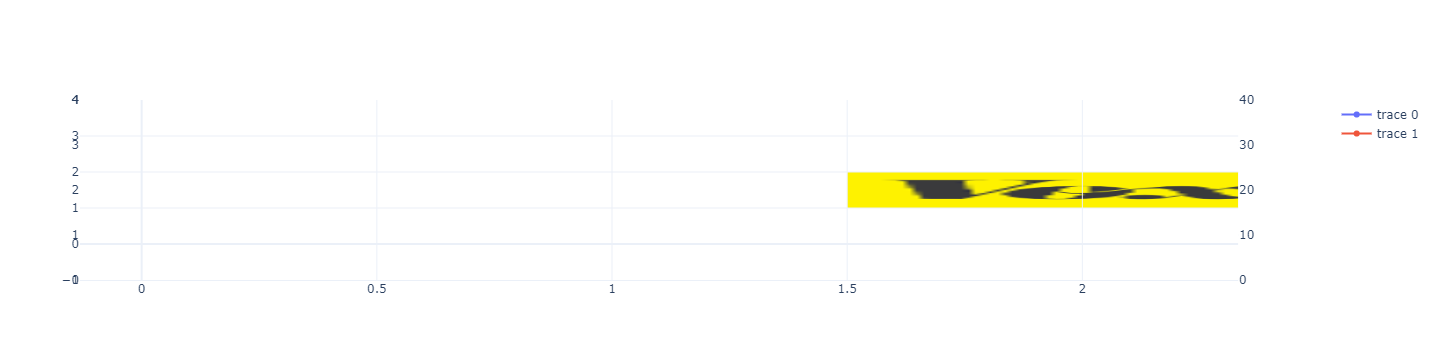
Below is an example for which the second image is visible
fig = make_subplots(rows=1, cols=1, specs=[[{"secondary_y": True}]])

# Add trace
fig.add_trace(go.Scatter(x=[0, 0.5, 1, 2, 2.2], y=[1.23, 2.5, 0.42, 3, 1]))
fig.add_trace(go.Scatter(x=[0, 0.5, 1, 2, 2.2], y=[10.23, 20.5, 1.42, 30, 10]), secondary_y=True)
fig.update_yaxes(range=[0, 4], secondary_y=False)
fig.update_yaxes(range=[0, 40], secondary_y=True)

fig.add_layout_image(
    dict(
        source="https://images.plot.ly/language-icons/api-home/python-logo.png",
        xref="x",
        yref="y",
        x=0,
        y=1,
        sizex=1,
        sizey=1,
        sizing="stretch",
        opacity=1.0,
        layer="below",
    ),
    secondary_y=False,
)

fig.add_layout_image(
    dict(
        source="https://raw.githubusercontent.com/cldougl/plot_images/add_r_img/vox.png",
        xref="x",
        yref="y2",
        x=1.5,
        y=2,
        sizex=1,
        sizey=1,
        sizing="stretch",
        opacity=1.0,
        layer="below",
    ),
    secondary_y=True,
)

# Set templates
fig.update_layout(template="plotly_white")

fig.show()

replacing yref="y2", by yref="y", the image becomes visible but is anchored with the primary y axis (visible because of the sizey=1 and also when moving the axis range)

replacing yref="y2", by yref="y3", the image becomes visible but it is the only visible element
Hướng dẫn đóng góp
Bắt đầu từ đâu
- Đọc hết issue, rồi đọc hướng dẫn đóng góp của dự án.
- Bình luận trên issue rằng bạn sẽ nhận — tránh hai người làm cùng một việc.
- Fork repository và làm thay đổi trên một nhánh.
- Mở pull request có tham chiếu số hiệu của issue.
Hướng nghiên cứu
Bắt đầu với bản tái hiện Python được cung cấp và lần theo điểm vào add_layout_image, tập trung vào cách xử lý secondary_y và yref="y2". Công việc hoàn tất khi cả hai hình ảnh layout đều được hiển thị ở đúng vị trí trên trục y chính và trục y phụ, đồng thời các trace được vẽ vẫn hiển thị.
Do mô hình lập chỉ mục viết ra từ nội dung của issue.
Đánh giá
- Công nghệ
- python
- Lĩnh vực
- data-visualization
- Loại issue
- Lỗi
- Độ khó
- 4/5
- Thời gian dự kiến
- 3-5 ngày
- Mức độ hoạt động
- Đình trệ
- Độ rõ ràng
- Khá rõ ràng
- Mức phù hợp với người mới
- 35/100