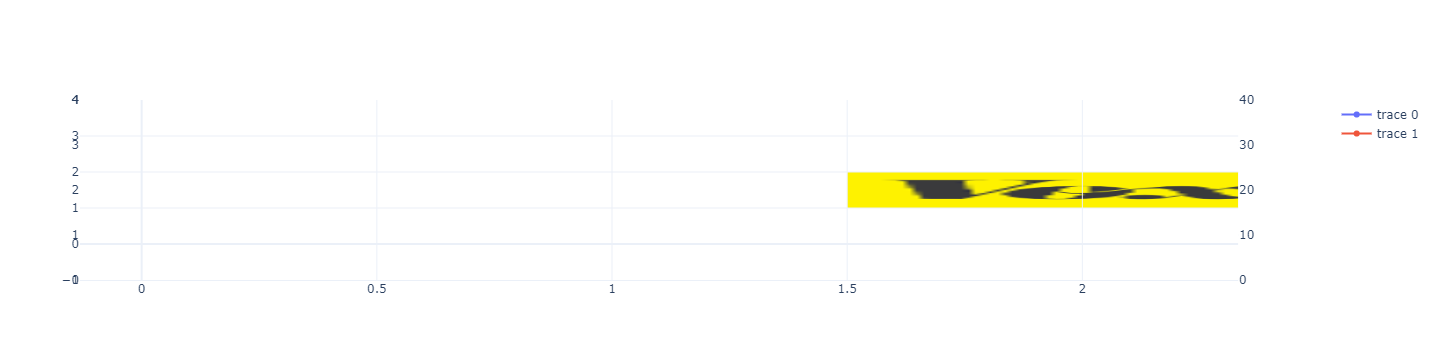
add_layout_image doesn't work with secondary_y
オープン
まだ誰も着手していません。
bug
P3
- 主要言語
- Python
- スター
- 18.8k
- フォーク
- 2.8k
- 平均マージ
- 16時間 26分
- マージ済み PR(30日)
- 21
説明
Below is an example for which the second image is visible
fig = make_subplots(rows=1, cols=1, specs=[[{"secondary_y": True}]])

# Add trace
fig.add_trace(go.Scatter(x=[0, 0.5, 1, 2, 2.2], y=[1.23, 2.5, 0.42, 3, 1]))
fig.add_trace(go.Scatter(x=[0, 0.5, 1, 2, 2.2], y=[10.23, 20.5, 1.42, 30, 10]), secondary_y=True)
fig.update_yaxes(range=[0, 4], secondary_y=False)
fig.update_yaxes(range=[0, 40], secondary_y=True)

fig.add_layout_image(
    dict(
        source="https://images.plot.ly/language-icons/api-home/python-logo.png",
        xref="x",
        yref="y",
        x=0,
        y=1,
        sizex=1,
        sizey=1,
        sizing="stretch",
        opacity=1.0,
        layer="below",
    ),
    secondary_y=False,
)

fig.add_layout_image(
    dict(
        source="https://raw.githubusercontent.com/cldougl/plot_images/add_r_img/vox.png",
        xref="x",
        yref="y2",
        x=1.5,
        y=2,
        sizex=1,
        sizey=1,
        sizing="stretch",
        opacity=1.0,
        layer="below",
    ),
    secondary_y=True,
)

# Set templates
fig.update_layout(template="plotly_white")

fig.show()

replacing yref="y2", by yref="y", the image becomes visible but is anchored with the primary y axis (visible because of the sizey=1 and also when moving the axis range)

replacing yref="y2", by yref="y3", the image becomes visible but it is the only visible element
コントリビューションガイド
はじめの一歩
- issue を最後まで読み、次にプロジェクトのコントリビューションガイドを読みます。
- 着手することを issue にコメントします — 二人が同じ作業をするのを防げます。
- リポジトリをフォークし、ブランチを切って変更します。
- issue 番号を参照したプルリクエストを送ります。
調査の方向性
提供された Python 再現コードから始め、エントリーポイント add_layout_image を追跡し、secondary_y と yref="y2" がどのように処理されるかに焦点を当てます。両方のレイアウト画像が一次および二次 y 軸の正しい位置にレンダリングされ、プロットされたトレースが表示されたままになれば、作業は完了です。
索引モデルが issue の本文から書いたものです。
評価
- 技術スタック
- python
- 領域
- data-visualization
- issue の種類
- バグ
- 難易度
- 4/5
- 見積もり時間
- 3〜5日
- 活発さ
- 停滞
- 明瞭さ
- おおむね明確
- 初心者へのやさしさ
- 35/100