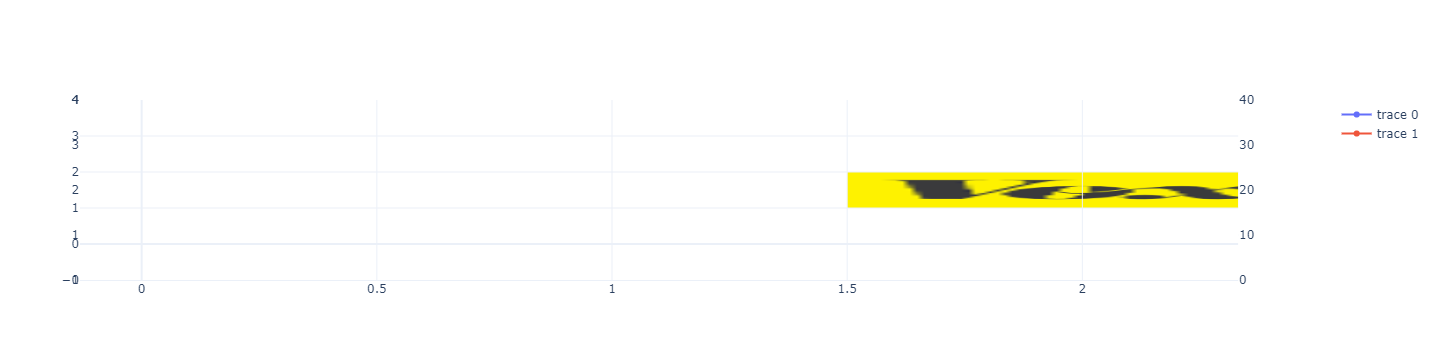
add_layout_image doesn't work with secondary_y
Dieses Issue hat noch niemand übernommen.
- Vorherrschende Sprache
- Python
- Sterne
- 18.8k
- Forks
- 2.8k
- Ø Merge
- 16 Std. 26 Min.
- Gemergte PRs (30 T.)
- 21
Beschreibung
Below is an example for which the second image is visible
fig = make_subplots(rows=1, cols=1, specs=[[{"secondary_y": True}]])

# Add trace
fig.add_trace(go.Scatter(x=[0, 0.5, 1, 2, 2.2], y=[1.23, 2.5, 0.42, 3, 1]))
fig.add_trace(go.Scatter(x=[0, 0.5, 1, 2, 2.2], y=[10.23, 20.5, 1.42, 30, 10]), secondary_y=True)
fig.update_yaxes(range=[0, 4], secondary_y=False)
fig.update_yaxes(range=[0, 40], secondary_y=True)

fig.add_layout_image(
    dict(
        source="https://images.plot.ly/language-icons/api-home/python-logo.png",
        xref="x",
        yref="y",
        x=0,
        y=1,
        sizex=1,
        sizey=1,
        sizing="stretch",
        opacity=1.0,
        layer="below",
    ),
    secondary_y=False,
)

fig.add_layout_image(
    dict(
        source="https://raw.githubusercontent.com/cldougl/plot_images/add_r_img/vox.png",
        xref="x",
        yref="y2",
        x=1.5,
        y=2,
        sizex=1,
        sizey=1,
        sizing="stretch",
        opacity=1.0,
        layer="below",
    ),
    secondary_y=True,
)

# Set templates
fig.update_layout(template="plotly_white")

fig.show()

replacing yref="y2", by yref="y", the image becomes visible but is anchored with the primary y axis (visible because of the sizey=1 and also when moving the axis range)

replacing yref="y2", by yref="y3", the image becomes visible but it is the only visible element
Beitragsleitfaden
Erste Schritte
- Lies das ganze Issue und danach den Beitragsleitfaden des Projekts.
- Schreib ins Issue, dass du es übernimmst — das erspart doppelte Arbeit.
- Forke das Repository und arbeite in einem Branch.
- Öffne einen Pull Request, der die Issue-Nummer nennt.
Rechercherichtung
Beginnen Sie mit der bereitgestellten Python-Reproduktion und verfolgen Sie den Einstiegspunkt add_layout_image, wobei Sie sich darauf konzentrieren, wie secondary_y und yref="y2" behandelt werden. Die Arbeit ist abgeschlossen, wenn beide Layout-Bilder an den korrekten Positionen der primären und sekundären y-Achse gerendert werden und die geplotteten Traces sichtbar bleiben.
Vom Indexierungsmodell aus dem Issue-Text verfasst.
Bewertung
- Tech-Stack
- python
- Bereich
- data-visualization
- Issue-Typ
- Bug
- Schwierigkeit
- 4/5
- Geschätzter Aufwand
- 3-5 Tage
- Aktivitätsstatus
- Veraltet
- Klarheit
- Größtenteils klar
- Anfängerfreundlichkeit
- 35/100