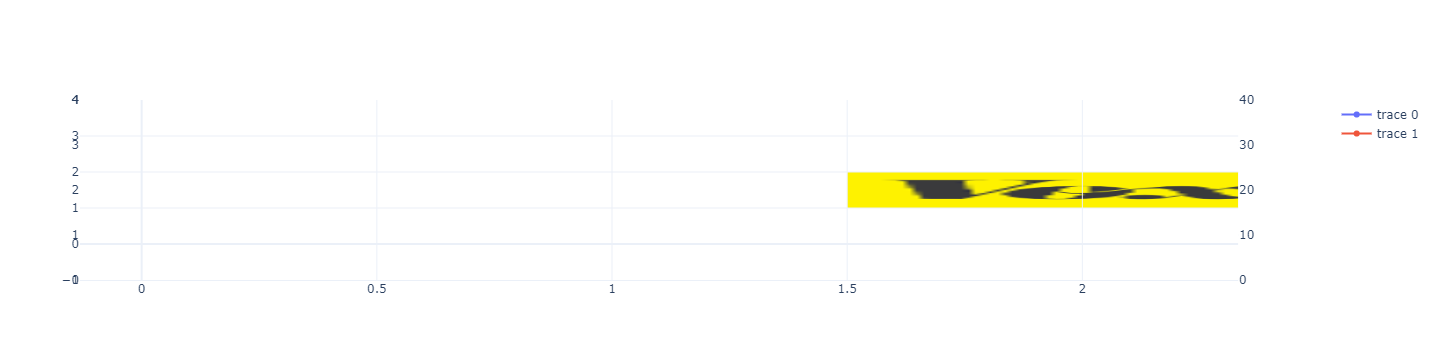
add_layout_image doesn't work with secondary_y
未关闭
还没有人认领这个 Issue。
bug
P3
- 主要语言
- Python
- 星标
- 18.8k
- 派生
- 2.8k
- 平均合并
- 16 小时 26 分钟
- 30 天内合并 PR
- 21
描述
Below is an example for which the second image is visible
fig = make_subplots(rows=1, cols=1, specs=[[{"secondary_y": True}]])

# Add trace
fig.add_trace(go.Scatter(x=[0, 0.5, 1, 2, 2.2], y=[1.23, 2.5, 0.42, 3, 1]))
fig.add_trace(go.Scatter(x=[0, 0.5, 1, 2, 2.2], y=[10.23, 20.5, 1.42, 30, 10]), secondary_y=True)
fig.update_yaxes(range=[0, 4], secondary_y=False)
fig.update_yaxes(range=[0, 40], secondary_y=True)

fig.add_layout_image(
    dict(
        source="https://images.plot.ly/language-icons/api-home/python-logo.png",
        xref="x",
        yref="y",
        x=0,
        y=1,
        sizex=1,
        sizey=1,
        sizing="stretch",
        opacity=1.0,
        layer="below",
    ),
    secondary_y=False,
)

fig.add_layout_image(
    dict(
        source="https://raw.githubusercontent.com/cldougl/plot_images/add_r_img/vox.png",
        xref="x",
        yref="y2",
        x=1.5,
        y=2,
        sizex=1,
        sizey=1,
        sizing="stretch",
        opacity=1.0,
        layer="below",
    ),
    secondary_y=True,
)

# Set templates
fig.update_layout(template="plotly_white")

fig.show()

replacing yref="y2", by yref="y", the image becomes visible but is anchored with the primary y axis (visible because of the sizey=1 and also when moving the axis range)

replacing yref="y2", by yref="y3", the image becomes visible but it is the only visible element
贡献指南
从这里开始
- 先读完整个 Issue,再读项目的贡献指南。
- 在 Issue 下留言说明你要接手 —— 这能避免两个人做同样的事。
- Fork 仓库,在一个分支上完成修改。
- 提交 Pull Request,并在描述里引用这个 Issue 编号。
调研方向
从提供的 Python 复现开始,跟踪 add_layout_image 入口,重点关注 secondary_y 和 yref="y2" 的处理方式。当两个布局图像都在主 y 轴和次 y 轴的正确位置渲染,同时绘制的 traces 仍保持可见时,工作即完成。
由索引模型根据 Issue 内容生成。
评估
- 技术栈
- python
- 领域
- data-visualization
- Issue 类型
- 缺陷
- 难度
- 4/5
- 预计耗时
- 3-5 天
- 活跃度
- 停滞
- 描述清晰度
- 基本清楚
- 新手友好度
- 35/100