enable assignment of "Download plot as a png" value to variable
Nobody has claimed this yet.
- Dominant language
- Python
- Stars
- 18.8k
- Forks
- 2.8k
- Avg merge
- 16h 26m
- Merged PRs (30d)
- 21
Description
Bug (or Feature Request?):
I want to get the annotated image after I used drawrect. The only possible way, for now, is using the Download plot as a png button, save it on pc, read it. Is there a straightforward way to do that?
I mark it as a bug (or maybe it's the intended behavior by the developer) because fig.to_image(format="png", engine="kaleido") return the original image, not the annotated one.
Note: I'm using a jupyter notebook
import plotly.graph_objects as go
fig = go.Figure(data=go.Bar(y=[2, 3, 1]))
config = dict({
    'modeBarButtonsToAdd':[
        'drawrect',
        'eraseshape',
    ],
    'modeBarButtonsToRemove':[
        'toggleSpikelines','hoverCompareCartesian'
    ]
})
fig.show(config=config)

do some annotations...
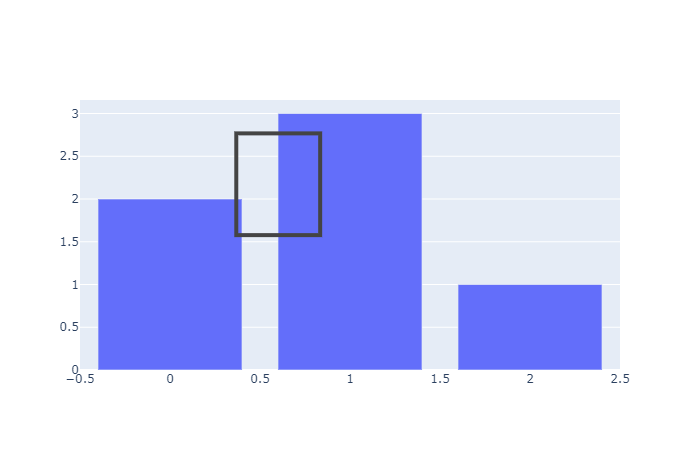
then run:
import numpy as np
import cv2
import matplotlib.pyplot as plt
annotate_image = fig.to_image(format="png", engine="kaleido")
nparr = np.frombuffer(annotate_image, np.uint8)
img_numpy = cv2.imdecode(nparr, cv2.IMREAD_COLOR)
plt.imshow(img_numpy[...,::-1])

The plt.imshow(img_numpy[...,::-1]) will show the original image, not the annotated image. How to use fig.to_image(format="png", engine="kaleido") to include the annotation of drawrect? Or any workaourd?
Contributor guide
First steps
- Read the whole issue, then the project's contributing guide.
- Comment on the issue to say you are picking it up — it saves two people doing the same work.
- Fork the repository and make your change on a branch.
- Open a pull request that references the issue number.
Research direction
Start with the fig.show(config=config) entry point and the drawrect interaction, then compare it with fig.to_image(format="png", engine="kaleido"). Determine whether the annotated state can be passed through the existing export path; done means the resulting assigned image includes the drawn rectangle. No repository files or tests are named in the issue.
Written by the indexing model from the issue text.
Assessment
- Tech stack
- jupyter-notebook, python
- Domain
- data-visualization
- Issue type
- Feature
- Difficulty
- 4/5
- Estimated time
- 3-5 days
- Activity status
- Stale
- Clarity
- Mostly clear
- Newbie friendliness
- 35/100