Wrong time displayed in hover text for some chart types
Nessuno ha ancora preso questa issue.
- Lingua principale
- R
- Stelle
- 2.7k
- Fork
- 641
- Metriche di merge delle PR
- Nessuna PR unita negli ultimi 30g
Descrizione
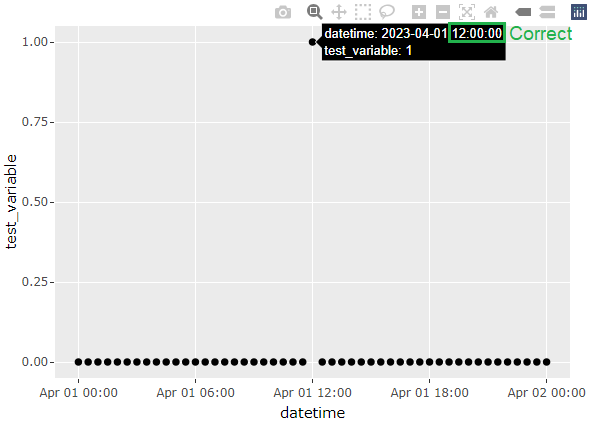
In the London time zone in BST period, the time displayed in the hover text is incorrect and is offset by one hour when converting a ggplot chart to Plotly. The issue is visible with bar chart and area chart, but not present with line chart and scatter plot. (Though I haven't tested all chart types so the issue could be more widespread.) The problem is present in plotly version 4.10.0 (ggplot2 version 3.6.6), but was not present in plotly version 4.9.3 (ggplot2 version 3.0.0).
library(ggplot2)
library(plotly)
library(lubridate)

Sys.setenv(TZ = "Europe/London")

datetime <- seq(ymd_hm("2023-04-01 00:00"), ymd_hm("2023-04-02 00:00"), by = "30 min")
df <- as.data.frame(datetime)
df$test_variable <- ifelse(df$datetime == ymd_hm("2023-04-01 12:00"), 1, 0)

#Line chart - no issue
ggplotly(
  ggplot(df, aes(datetime, test_variable)) +
    geom_line()
)

#Scatter plot - no issue
ggplotly(
  ggplot(df, aes(datetime, test_variable)) +
    geom_point()
)

#Bar chart - wrong time displayed
ggplotly(
  ggplot(df, aes(datetime, test_variable)) +
    geom_col()
)

#Area chart - wrong time displayed
ggplotly(
  ggplot(df, aes(datetime, test_variable)) +
    geom_area()
)



Guida per i contributori
Apri la guida per i contributori
Come iniziare
- Leggi tutta la issue e poi la guida ai contributi del progetto.
- Commenta sulla issue per dire che te ne occupi tu — evita che due persone facciano lo stesso lavoro.
- Fai un fork del repository e lavora su un branch.
- Apri una pull request che faccia riferimento al numero della issue.
Direzione di ricerca
Inizia con la riproduzione R fornita usando Europe/London durante BST, confrontando l’output di ggplotly() per geom_col() e geom_area() con i grafici a linee e a dispersione. Il lavoro è completato quando il testo al passaggio del mouse mostra l’ora locale corretta per i tipi di grafico interessati, senza regressioni nei tipi di grafico che già funzionano.
Scritto dal modello di indicizzazione a partire dal testo della issue.
Valutazione
- Stack tecnologico
- r
- Ambito
- data-visualization
- Tipo di issue
- Bug
- Difficoltà
- 3/5
- Tempo stimato
- 1-2 giorni
- Stato di attività
- Ferma
- Chiarezza
- Abbastanza chiara
- Idoneità per principianti
- 50/100