Wrong time displayed in hover text for some chart types
Nadie ha tomado este issue todavía.
- Lenguaje dominante
- R
- Estrellas
- 2.7k
- Forks
- 641
- Métricas de merge de PR
- Sin PR fusionados en 30 d
Descripción
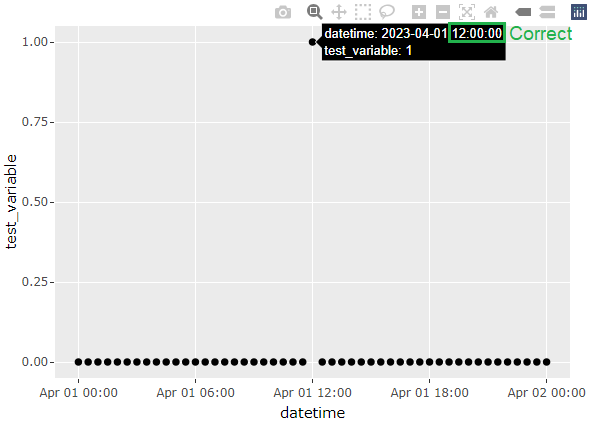
In the London time zone in BST period, the time displayed in the hover text is incorrect and is offset by one hour when converting a ggplot chart to Plotly. The issue is visible with bar chart and area chart, but not present with line chart and scatter plot. (Though I haven't tested all chart types so the issue could be more widespread.) The problem is present in plotly version 4.10.0 (ggplot2 version 3.6.6), but was not present in plotly version 4.9.3 (ggplot2 version 3.0.0).
library(ggplot2)
library(plotly)
library(lubridate)

Sys.setenv(TZ = "Europe/London")

datetime <- seq(ymd_hm("2023-04-01 00:00"), ymd_hm("2023-04-02 00:00"), by = "30 min")
df <- as.data.frame(datetime)
df$test_variable <- ifelse(df$datetime == ymd_hm("2023-04-01 12:00"), 1, 0)

#Line chart - no issue
ggplotly(
  ggplot(df, aes(datetime, test_variable)) +
    geom_line()
)

#Scatter plot - no issue
ggplotly(
  ggplot(df, aes(datetime, test_variable)) +
    geom_point()
)

#Bar chart - wrong time displayed
ggplotly(
  ggplot(df, aes(datetime, test_variable)) +
    geom_col()
)

#Area chart - wrong time displayed
ggplotly(
  ggplot(df, aes(datetime, test_variable)) +
    geom_area()
)



Guía de contribución
Primeros pasos
- Lee el issue completo y luego la guía de contribución del proyecto.
- Comenta en el issue que vas a ocuparte — evita que dos personas hagan lo mismo.
- Haz un fork del repositorio y trabaja en una rama.
- Abre un pull request que haga referencia al número del issue.
Línea de trabajo
Comienza con la reproducción en R proporcionada usando Europe/London durante BST, comparando la salida de ggplotly() para geom_col() y geom_area() con los gráficos de líneas y de dispersión. Se considera terminado cuando el texto emergente muestra la hora local correcta para los tipos de gráfico afectados sin regresiones en los tipos de gráfico que ya funcionan.
Escrito por el modelo de indexación a partir del texto del issue.
Evaluación
- Stack tecnológico
- r
- Área
- data-visualization
- Tipo de issue
- Error
- Dificultad
- 3/5
- Tiempo estimado
- 1-2 días
- Estado de actividad
- Estancado
- Claridad
- Bastante claro
- Aptitud para principiantes
- 50/100