Wrong time displayed in hover text for some chart types
Nobody has claimed this yet.
- Dominant language
- R
- Stars
- 2.7k
- Forks
- 641
- PR merge metrics
- No merged PRs in 30d
Description
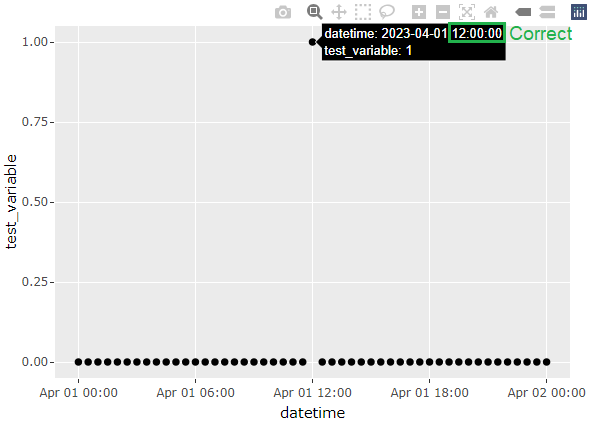
In the London time zone in BST period, the time displayed in the hover text is incorrect and is offset by one hour when converting a ggplot chart to Plotly. The issue is visible with bar chart and area chart, but not present with line chart and scatter plot. (Though I haven't tested all chart types so the issue could be more widespread.) The problem is present in plotly version 4.10.0 (ggplot2 version 3.6.6), but was not present in plotly version 4.9.3 (ggplot2 version 3.0.0).
library(ggplot2)
library(plotly)
library(lubridate)

Sys.setenv(TZ = "Europe/London")

datetime <- seq(ymd_hm("2023-04-01 00:00"), ymd_hm("2023-04-02 00:00"), by = "30 min")
df <- as.data.frame(datetime)
df$test_variable <- ifelse(df$datetime == ymd_hm("2023-04-01 12:00"), 1, 0)

#Line chart - no issue
ggplotly(
  ggplot(df, aes(datetime, test_variable)) +
    geom_line()
)

#Scatter plot - no issue
ggplotly(
  ggplot(df, aes(datetime, test_variable)) +
    geom_point()
)

#Bar chart - wrong time displayed
ggplotly(
  ggplot(df, aes(datetime, test_variable)) +
    geom_col()
)

#Area chart - wrong time displayed
ggplotly(
  ggplot(df, aes(datetime, test_variable)) +
    geom_area()
)



Contributor guide
First steps
- Read the whole issue, then the project's contributing guide.
- Comment on the issue to say you are picking it up — it saves two people doing the same work.
- Fork the repository and make your change on a branch.
- Open a pull request that references the issue number.
Research direction
Start with the supplied R reproduction using Europe/London during BST, comparing ggplotly() output for geom_col() and geom_area() against line and scatter plots. Done means hover text shows the correct local time for the affected chart types without regressing the chart types that already work.
Written by the indexing model from the issue text.
Assessment
- Tech stack
- r
- Domain
- data-visualization
- Issue type
- Bug
- Difficulty
- 3/5
- Estimated time
- 1-2 days
- Activity status
- Stale
- Clarity
- Mostly clear
- Newbie friendliness
- 50/100