partial bar highlight does not work on `geom_bar()` or `geom_hist()` converted with `ggplotly()`
Chưa có ai nhận issue này.
- Ngôn ngữ chính
- R
- Star
- 2.7k
- Fork
- 641
- Chỉ số merge pull request
- Không có pull request nào được merge trong 30 ngày
Mô tả
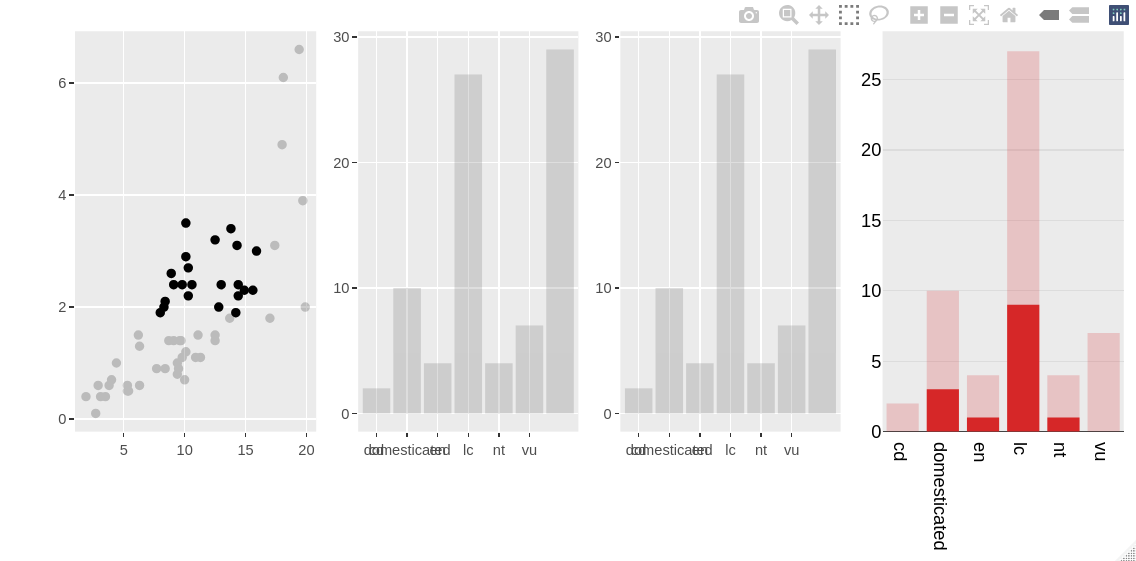
A highlighted plotly "histogram" can have its bars partially highlighted (with best results achieved with the "overlay" barmode), but an equivalent ggplot2 object converted with ggplotly() can't.
This reproducible example showcases all three options. One can drag a rectangle around some points to see that only the pure plotly visualisation gets bar overlays. A bar will only be completely highlighted if all the cases for that bar are selected in the scatterplot.
library(ggplot2)
library(plotly)
# set up highlightable dataset
msleep_h <- highlight_key(msleep)
# scatterplot
gg_point <- (ggplot(msleep_h, aes(x = sleep_total, y = sleep_rem)) +
  geom_point()) %>%
  ggplotly()
# ggplot2 bar chart does a count
gg_bar <- (ggplot(msleep_h, aes(x = conservation)) +
  geom_bar()) %>%
  ggplotly() %>%
  layout(barmode = "overlay")
# also try a histogram geom, which requires switching to the count stat
gg_hist <- (ggplot(msleep_h, aes(x = conservation)) +
             geom_histogram(stat = "count")) %>%
  ggplotly() %>%
  layout(barmode = "overlay")
# plotly equivalent
plt_hist <- plot_ly(msleep_h) %>%
  add_histogram(x = ~conservation) %>%
  layout(barmode = "overlay")
# side by side
subplot(gg_point, gg_bar, gg_hist, plt_hist) %>%
  highlight("plotly_selected")
Hướng dẫn đóng góp
Bắt đầu từ đâu
- Đọc hết issue, rồi đọc hướng dẫn đóng góp của dự án.
- Bình luận trên issue rằng bạn sẽ nhận — tránh hai người làm cùng một việc.
- Fork repository và làm thay đổi trên một nhánh.
- Mở pull request có tham chiếu số hiệu của issue.
Hướng nghiên cứu
Bắt đầu với ví dụ R có thể tái hiện trong issue, đặc biệt là các chuyển đổi ggplotly() của geom_bar() và geom_histogram(stat = "count"), cùng với lời gọi highlight("plotly_selected") cuối cùng. So sánh hành vi chọn của chúng với histogram plotly thuần sử dụng barmode = "overlay"; được xem là hoàn thành khi việc chọn một phần của một thanh chỉ phủ chồng các trường hợp đã chọn trong cả hai biểu đồ đã chuyển đổi.
Do mô hình lập chỉ mục viết ra từ nội dung của issue.
Đánh giá
- Công nghệ
- r
- Lĩnh vực
- data-visualization
- Loại issue
- Lỗi
- Độ khó
- 4/5
- Thời gian dự kiến
- 3-5 ngày
- Mức độ hoạt động
- Đình trệ
- Độ rõ ràng
- Khá rõ ràng
- Mức phù hợp với người mới
- 35/100