partial bar highlight does not work on `geom_bar()` or `geom_hist()` converted with `ggplotly()`
Nadie ha tomado este issue todavía.
- Lenguaje dominante
- R
- Estrellas
- 2.7k
- Forks
- 641
- Métricas de merge de PR
- Sin PR fusionados en 30 d
Descripción
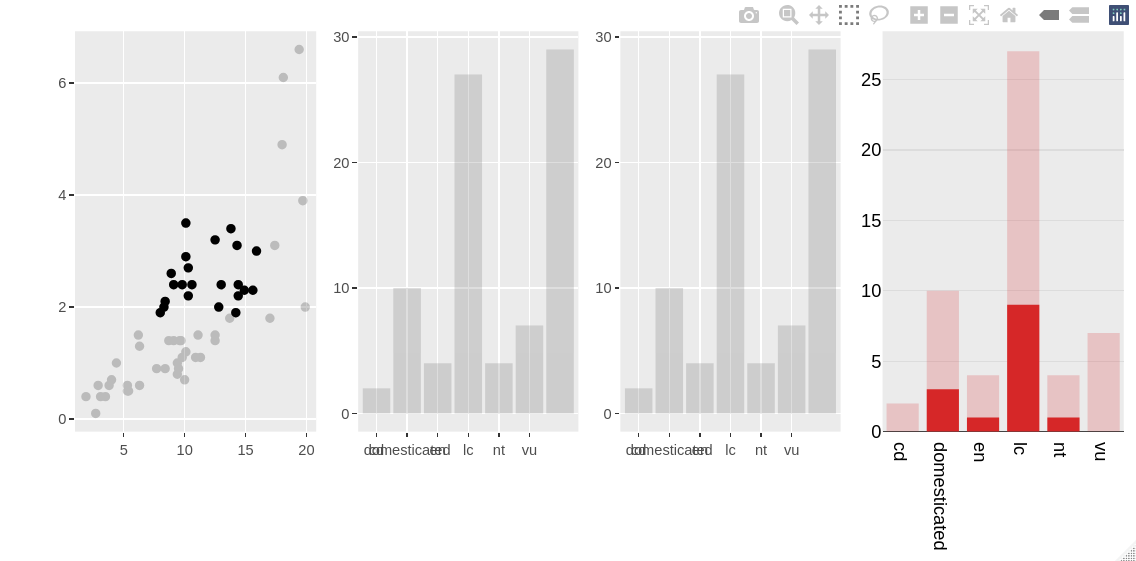
A highlighted plotly "histogram" can have its bars partially highlighted (with best results achieved with the "overlay" barmode), but an equivalent ggplot2 object converted with ggplotly() can't.
This reproducible example showcases all three options. One can drag a rectangle around some points to see that only the pure plotly visualisation gets bar overlays. A bar will only be completely highlighted if all the cases for that bar are selected in the scatterplot.
library(ggplot2)
library(plotly)
# set up highlightable dataset
msleep_h <- highlight_key(msleep)
# scatterplot
gg_point <- (ggplot(msleep_h, aes(x = sleep_total, y = sleep_rem)) +
  geom_point()) %>%
  ggplotly()
# ggplot2 bar chart does a count
gg_bar <- (ggplot(msleep_h, aes(x = conservation)) +
  geom_bar()) %>%
  ggplotly() %>%
  layout(barmode = "overlay")
# also try a histogram geom, which requires switching to the count stat
gg_hist <- (ggplot(msleep_h, aes(x = conservation)) +
             geom_histogram(stat = "count")) %>%
  ggplotly() %>%
  layout(barmode = "overlay")
# plotly equivalent
plt_hist <- plot_ly(msleep_h) %>%
  add_histogram(x = ~conservation) %>%
  layout(barmode = "overlay")
# side by side
subplot(gg_point, gg_bar, gg_hist, plt_hist) %>%
  highlight("plotly_selected")
Guía de contribución
Primeros pasos
- Lee el issue completo y luego la guía de contribución del proyecto.
- Comenta en el issue que vas a ocuparte — evita que dos personas hagan lo mismo.
- Haz un fork del repositorio y trabaja en una rama.
- Abre un pull request que haga referencia al número del issue.
Línea de trabajo
Empieza por el ejemplo reproducible en R del issue, especialmente por las conversiones de ggplotly() de geom_bar() y geom_histogram(stat = "count"), y por la llamada final a highlight("plotly_selected"). Compara su comportamiento de selección con el histograma de plotly puro usando barmode = "overlay"; se considera terminado cuando seleccionar una parte de una barra superpone únicamente los casos seleccionados en ambos gráficos convertidos.
Escrito por el modelo de indexación a partir del texto del issue.
Evaluación
- Stack tecnológico
- r
- Área
- data-visualization
- Tipo de issue
- Error
- Dificultad
- 4/5
- Tiempo estimado
- 3-5 días
- Estado de actividad
- Estancado
- Claridad
- Bastante claro
- Aptitud para principiantes
- 35/100