partial bar highlight does not work on `geom_bar()` or `geom_hist()` converted with `ggplotly()`
まだ誰も着手していません。
- 主要言語
- R
- スター
- 2.7k
- フォーク
- 641
- PR マージ指標
- 30日以内にマージされた PR はありません
説明
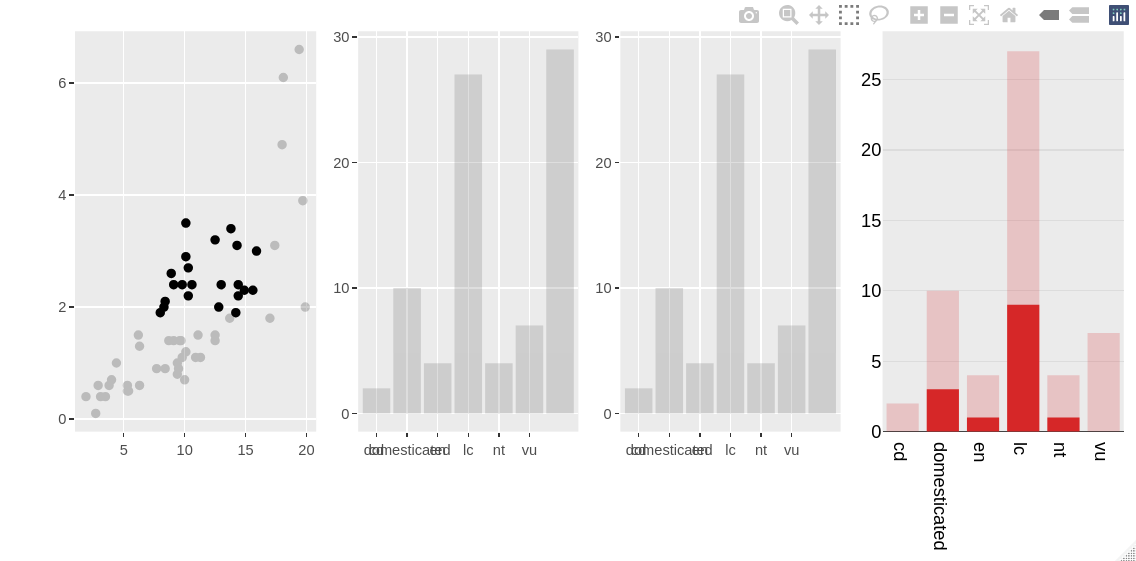
A highlighted plotly "histogram" can have its bars partially highlighted (with best results achieved with the "overlay" barmode), but an equivalent ggplot2 object converted with ggplotly() can't.
This reproducible example showcases all three options. One can drag a rectangle around some points to see that only the pure plotly visualisation gets bar overlays. A bar will only be completely highlighted if all the cases for that bar are selected in the scatterplot.
library(ggplot2)
library(plotly)
# set up highlightable dataset
msleep_h <- highlight_key(msleep)
# scatterplot
gg_point <- (ggplot(msleep_h, aes(x = sleep_total, y = sleep_rem)) +
  geom_point()) %>%
  ggplotly()
# ggplot2 bar chart does a count
gg_bar <- (ggplot(msleep_h, aes(x = conservation)) +
  geom_bar()) %>%
  ggplotly() %>%
  layout(barmode = "overlay")
# also try a histogram geom, which requires switching to the count stat
gg_hist <- (ggplot(msleep_h, aes(x = conservation)) +
             geom_histogram(stat = "count")) %>%
  ggplotly() %>%
  layout(barmode = "overlay")
# plotly equivalent
plt_hist <- plot_ly(msleep_h) %>%
  add_histogram(x = ~conservation) %>%
  layout(barmode = "overlay")
# side by side
subplot(gg_point, gg_bar, gg_hist, plt_hist) %>%
  highlight("plotly_selected")
コントリビューションガイド
はじめの一歩
- issue を最後まで読み、次にプロジェクトのコントリビューションガイドを読みます。
- 着手することを issue にコメントします — 二人が同じ作業をするのを防げます。
- リポジトリをフォークし、ブランチを切って変更します。
- issue 番号を参照したプルリクエストを送ります。
調査の方向性
issue にある再現可能な R の例から始め、特に geom_bar() と geom_histogram(stat = "count") の ggplotly() 変換、および最後の highlight("plotly_selected") 呼び出しを確認してください。barmode = "overlay" を使用する純粋な plotly ヒストグラムと選択動作を比較してください。完了条件は、バーの一部を選択すると、両方の変換後のプロットで選択されたケースだけがオーバーレイされることです。
索引モデルが issue の本文から書いたものです。
評価
- 技術スタック
- r
- 領域
- data-visualization
- issue の種類
- バグ
- 難易度
- 4/5
- 見積もり時間
- 3〜5日
- 活発さ
- 停滞
- 明瞭さ
- おおむね明確
- 初心者へのやさしさ
- 35/100