partial bar highlight does not work on `geom_bar()` or `geom_hist()` converted with `ggplotly()`
Dieses Issue hat noch niemand übernommen.
- Vorherrschende Sprache
- R
- Sterne
- 2.7k
- Forks
- 641
- PR-Merge-Kennzahlen
- Keine gemergten PRs in 30 T.
Beschreibung
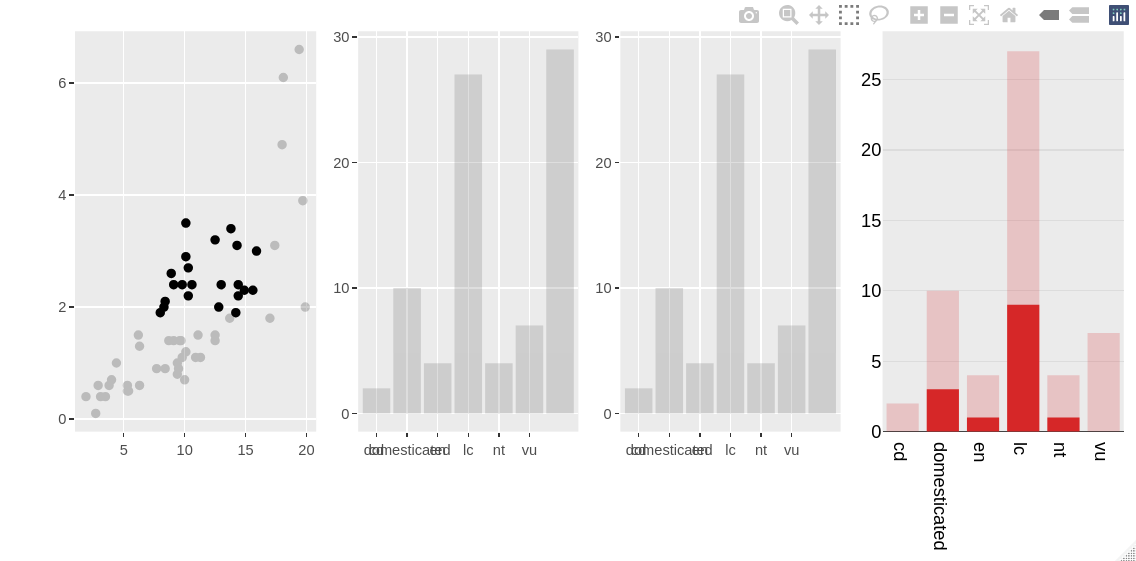
A highlighted plotly "histogram" can have its bars partially highlighted (with best results achieved with the "overlay" barmode), but an equivalent ggplot2 object converted with ggplotly() can't.
This reproducible example showcases all three options. One can drag a rectangle around some points to see that only the pure plotly visualisation gets bar overlays. A bar will only be completely highlighted if all the cases for that bar are selected in the scatterplot.
library(ggplot2)
library(plotly)
# set up highlightable dataset
msleep_h <- highlight_key(msleep)
# scatterplot
gg_point <- (ggplot(msleep_h, aes(x = sleep_total, y = sleep_rem)) +
  geom_point()) %>%
  ggplotly()
# ggplot2 bar chart does a count
gg_bar <- (ggplot(msleep_h, aes(x = conservation)) +
  geom_bar()) %>%
  ggplotly() %>%
  layout(barmode = "overlay")
# also try a histogram geom, which requires switching to the count stat
gg_hist <- (ggplot(msleep_h, aes(x = conservation)) +
             geom_histogram(stat = "count")) %>%
  ggplotly() %>%
  layout(barmode = "overlay")
# plotly equivalent
plt_hist <- plot_ly(msleep_h) %>%
  add_histogram(x = ~conservation) %>%
  layout(barmode = "overlay")
# side by side
subplot(gg_point, gg_bar, gg_hist, plt_hist) %>%
  highlight("plotly_selected")
Beitragsleitfaden
Erste Schritte
- Lies das ganze Issue und danach den Beitragsleitfaden des Projekts.
- Schreib ins Issue, dass du es übernimmst — das erspart doppelte Arbeit.
- Forke das Repository und arbeite in einem Branch.
- Öffne einen Pull Request, der die Issue-Nummer nennt.
Rechercherichtung
Beginne mit dem reproduzierbaren R-Beispiel im Issue, insbesondere den ggplotly()-Konvertierungen von geom_bar() und geom_histogram(stat = "count") sowie dem abschließenden highlight("plotly_selected")-Aufruf. Vergleiche ihr Auswahlverhalten mit dem reinen plotly-Histogramm mit barmode = "overlay"; abgeschlossen ist die Aufgabe, wenn bei der Auswahl eines Teils eines Balkens in beiden konvertierten Plots nur die ausgewählten Fälle überlagert werden.
Vom Indexierungsmodell aus dem Issue-Text verfasst.
Bewertung
- Tech-Stack
- r
- Bereich
- data-visualization
- Issue-Typ
- Bug
- Schwierigkeit
- 4/5
- Geschätzter Aufwand
- 3-5 Tage
- Aktivitätsstatus
- Veraltet
- Klarheit
- Größtenteils klar
- Anfängerfreundlichkeit
- 35/100