confusing API for heatmap legend
まだ誰も着手していません。
- 主要言語
- R
- スター
- 2.7k
- フォーク
- 641
- PR マージ指標
- 30日以内にマージされた PR はありません
説明
When trying to customize the legend for a heatmap I would expect that to be done through the layout similar to other trace types.
plot_ly(
  z = volcano,
  type = "heatmap",
) %>%
  layout(
    legend = list(
      title = list(
        text = "custom title"
      )
    )
  )
After digging around for a while and examining the output of plotly_build() %>% plotly_json() I found that this is done through the top level colorbar instead.
plot_ly(
  z = volcano,
  type = "heatmap",
  colorbar = list(
    title = "custom title"
  )
)
I would say that if the interface for this needs to be different than for other traces, that should be documented on the heatmap page. Even better may be to standardize the approach so that users always know to go to layout for this type of thing.
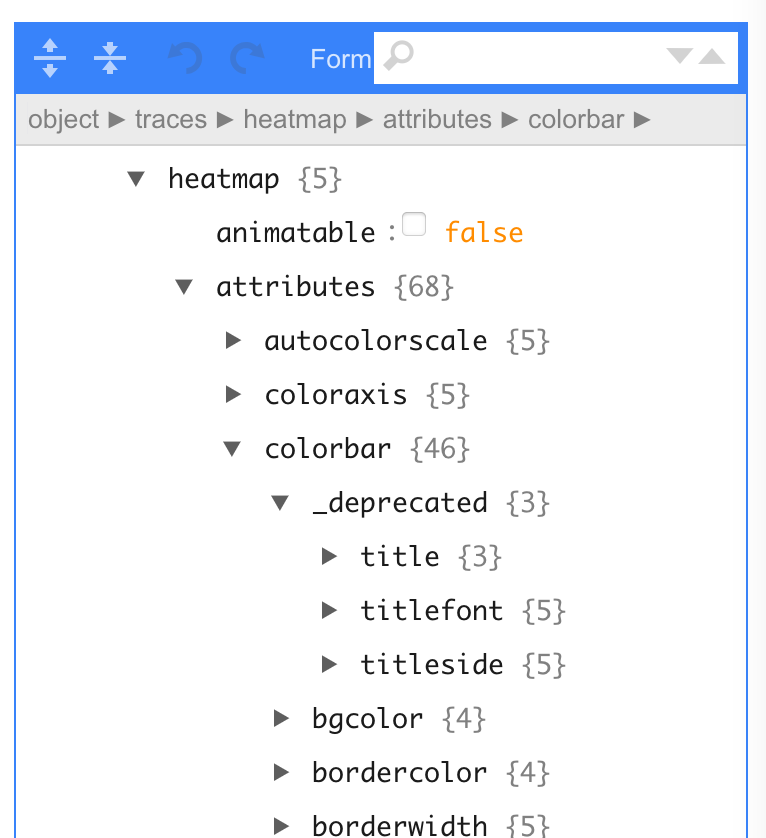
I'm also curious why colorbar title is shown as a deprecated attribute from schema().
コントリビューションガイド
はじめの一歩
- issue を最後まで読み、次にプロジェクトのコントリビューションガイドを読みます。
- 着手することを issue にコメントします — 二人が同じ作業をするのを防げます。
- リポジトリをフォークし、ブランチを切って変更します。
- issue 番号を参照したプルリクエストを送ります。
調査の方向性
issue にリンクされている R のヒートマップページから始め、そこに記載されている例を、同じくそこで説明されている plotly_build() と plotly_json() の出力と併せて確認します。ヒートマップの凡例のカスタマイズではトップレベルの colorbar を使用することを、schema() の非推奨化に関する詳細も含めて文書化します。新人が文書化されたインターフェースを見つけて利用できれば完了です。
索引モデルが issue の本文から書いたものです。
評価
- 技術スタック
- r
- 領域
- data-visualization
- issue の種類
- ドキュメント
- 難易度
- 2/5
- 見積もり時間
- 1〜3時間
- 活発さ
- 停滞
- 明瞭さ
- おおむね明確
- 初心者へのやさしさ
- 45/100