confusing API for heatmap legend
Nobody has claimed this yet.
- Dominant language
- R
- Stars
- 2.7k
- Forks
- 641
- PR merge metrics
- No merged PRs in 30d
Description
When trying to customize the legend for a heatmap I would expect that to be done through the layout similar to other trace types.
plot_ly(
  z = volcano,
  type = "heatmap",
) %>%
  layout(
    legend = list(
      title = list(
        text = "custom title"
      )
    )
  )
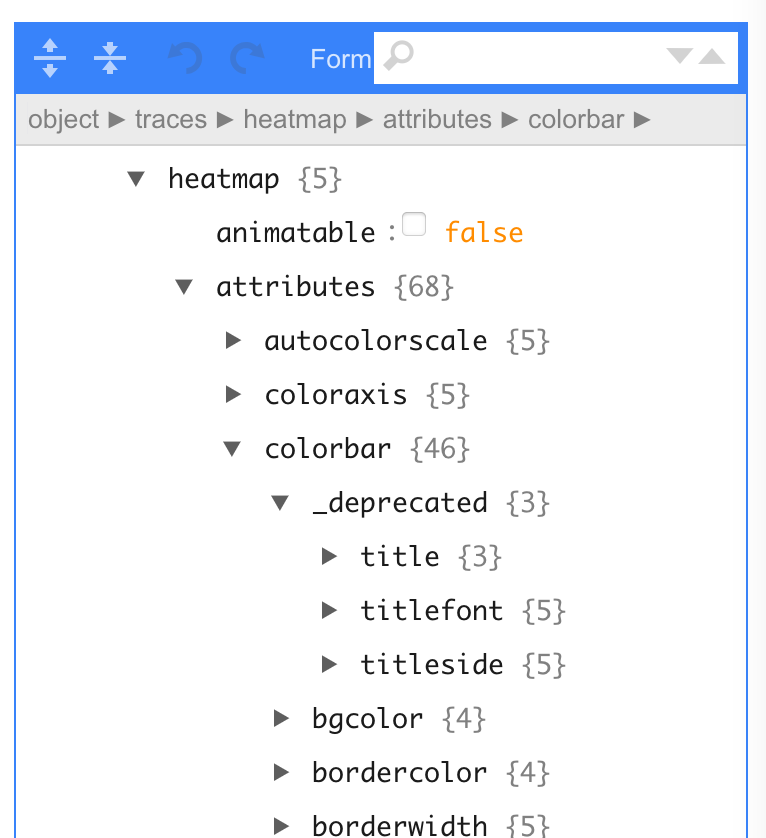
After digging around for a while and examining the output of plotly_build() %>% plotly_json() I found that this is done through the top level colorbar instead.
plot_ly(
  z = volcano,
  type = "heatmap",
  colorbar = list(
    title = "custom title"
  )
)
I would say that if the interface for this needs to be different than for other traces, that should be documented on the heatmap page. Even better may be to standardize the approach so that users always know to go to layout for this type of thing.
I'm also curious why colorbar title is shown as a deprecated attribute from schema().
Contributor guide
First steps
- Read the whole issue, then the project's contributing guide.
- Comment on the issue to say you are picking it up — it saves two people doing the same work.
- Fork the repository and make your change on a branch.
- Open a pull request that references the issue number.
Research direction
Start with the R heatmap page linked in the issue and inspect the documented examples alongside the plotly_build() and plotly_json() output described there. Document that heatmap legend customization uses the top-level colorbar, including the schema() deprecation detail; completion means a newcomer can find and follow the documented interface.
Written by the indexing model from the issue text.
Assessment
- Tech stack
- r
- Domain
- data-visualization
- Issue type
- Documentation
- Difficulty
- 2/5
- Estimated time
- 1-3 hours
- Activity status
- Stale
- Clarity
- Mostly clear
- Newbie friendliness
- 45/100