confusing API for heatmap legend
Dieses Issue hat noch niemand übernommen.
- Vorherrschende Sprache
- R
- Sterne
- 2.7k
- Forks
- 641
- PR-Merge-Kennzahlen
- Keine gemergten PRs in 30 T.
Beschreibung
When trying to customize the legend for a heatmap I would expect that to be done through the layout similar to other trace types.
plot_ly(
  z = volcano,
  type = "heatmap",
) %>%
  layout(
    legend = list(
      title = list(
        text = "custom title"
      )
    )
  )
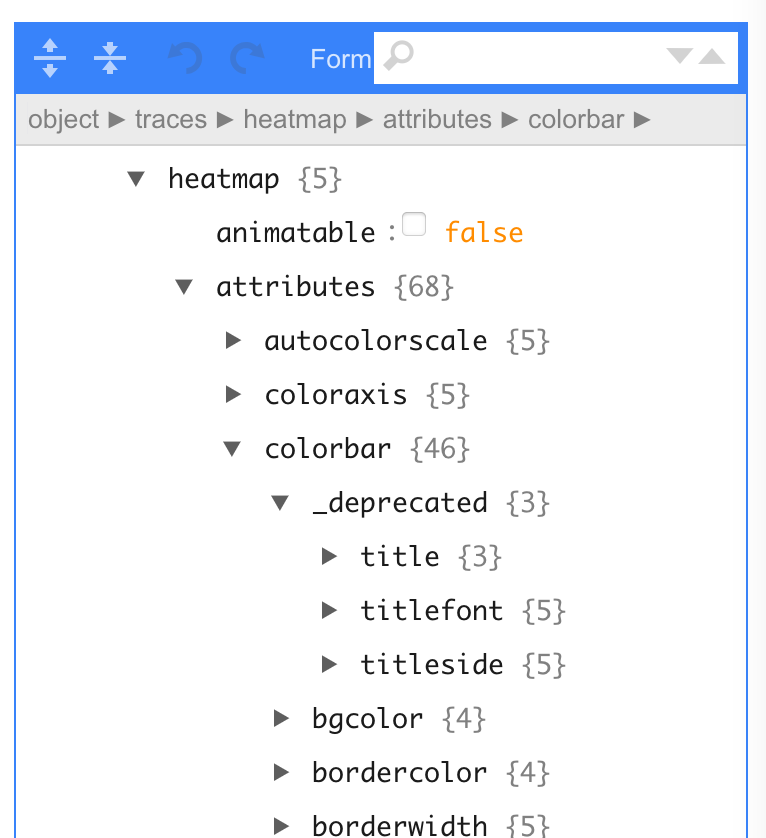
After digging around for a while and examining the output of plotly_build() %>% plotly_json() I found that this is done through the top level colorbar instead.
plot_ly(
  z = volcano,
  type = "heatmap",
  colorbar = list(
    title = "custom title"
  )
)
I would say that if the interface for this needs to be different than for other traces, that should be documented on the heatmap page. Even better may be to standardize the approach so that users always know to go to layout for this type of thing.
I'm also curious why colorbar title is shown as a deprecated attribute from schema().
Beitragsleitfaden
Erste Schritte
- Lies das ganze Issue und danach den Beitragsleitfaden des Projekts.
- Schreib ins Issue, dass du es übernimmst — das erspart doppelte Arbeit.
- Forke das Repository und arbeite in einem Branch.
- Öffne einen Pull Request, der die Issue-Nummer nennt.
Rechercherichtung
Beginne mit der im Issue verlinkten R-Heatmap-Seite und prüfe die dort dokumentierten Beispiele zusammen mit der dort beschriebenen Ausgabe von plotly_build() und plotly_json(). Dokumentiere, dass die Anpassung der Heatmap-Legende den colorbar auf der obersten Ebene verwendet, einschließlich des Details zur Abkündigung von schema(); abgeschlossen ist die Aufgabe, wenn ein Neuling die dokumentierte Schnittstelle finden und befolgen kann.
Vom Indexierungsmodell aus dem Issue-Text verfasst.
Bewertung
- Tech-Stack
- r
- Bereich
- data-visualization
- Issue-Typ
- Dokumentation
- Schwierigkeit
- 2/5
- Geschätzter Aufwand
- 1-3 Stunden
- Aktivitätsstatus
- Veraltet
- Klarheit
- Größtenteils klar
- Anfängerfreundlichkeit
- 45/100