confusing API for heatmap legend
还没有人认领这个 Issue。
- 主要语言
- R
- 星标
- 2.7k
- 派生
- 641
- PR 合并指标
- 30 天内没有已合并 PR
描述
When trying to customize the legend for a heatmap I would expect that to be done through the layout similar to other trace types.
plot_ly(
  z = volcano,
  type = "heatmap",
) %>%
  layout(
    legend = list(
      title = list(
        text = "custom title"
      )
    )
  )
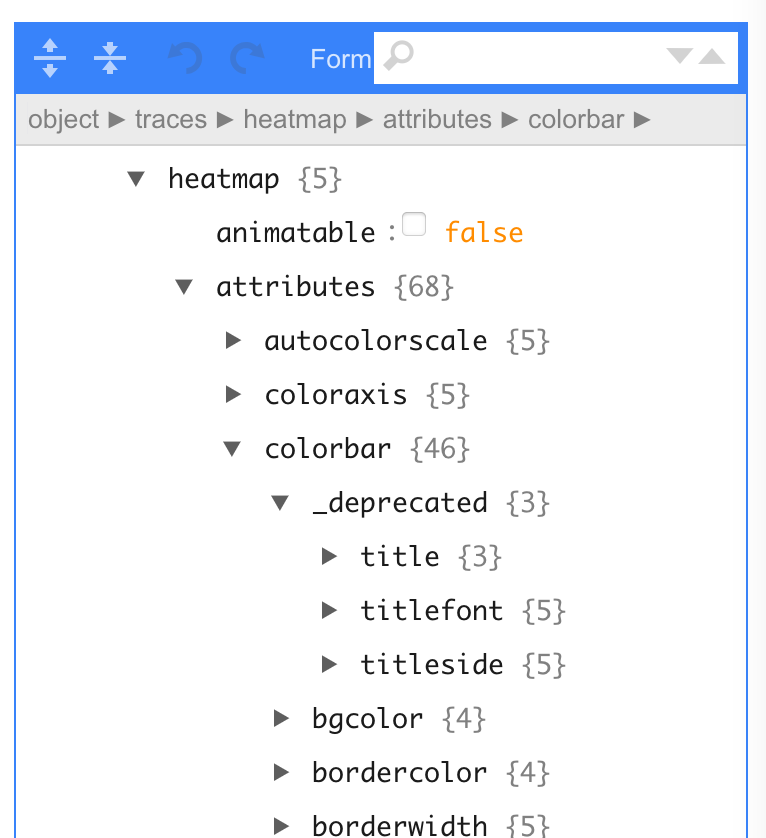
After digging around for a while and examining the output of plotly_build() %>% plotly_json() I found that this is done through the top level colorbar instead.
plot_ly(
  z = volcano,
  type = "heatmap",
  colorbar = list(
    title = "custom title"
  )
)
I would say that if the interface for this needs to be different than for other traces, that should be documented on the heatmap page. Even better may be to standardize the approach so that users always know to go to layout for this type of thing.
I'm also curious why colorbar title is shown as a deprecated attribute from schema().
贡献指南
从这里开始
- 先读完整个 Issue,再读项目的贡献指南。
- 在 Issue 下留言说明你要接手 —— 这能避免两个人做同样的事。
- Fork 仓库,在一个分支上完成修改。
- 提交 Pull Request,并在描述里引用这个 Issue 编号。
调研方向
从 issue 中链接的 R 热力图页面开始,检查其中记录的示例,以及页面所述的 plotly_build() 和 plotly_json() 输出。记录热力图图例的自定义使用顶层 colorbar,包括 schema() 弃用的相关细节;当新贡献者能够找到并遵循记录的接口时,即表示完成。
由索引模型根据 Issue 内容生成。
评估
- 技术栈
- r
- 领域
- data-visualization
- Issue 类型
- 文档
- 难度
- 2/5
- 预计耗时
- 1-3 小时
- 活跃度
- 停滞
- 描述清晰度
- 基本清楚
- 新手友好度
- 45/100