Issue with log scale displaying floating point numbers when on x axis.
オープン
まだ誰も着手していません。
- 主要言語
- R
- スター
- 2.7k
- フォーク
- 641
- PR マージ指標
- 30日以内にマージされた PR はありません
説明
The log scale should display rounded integers, but is displaying floating points with many decimal places. Seems to be fine though when the log scale is on the y axis. Also does not happen all the time. Works for another graph I have.
Brief description of the problem
library(plotly)
library(tibble)


# fake data
df <- tibble(geog_area = letters[1:10],
             value = runif(10, 100, 100000))

plot_ly() %>%
  add_trace(data = df,
            x = ~value,
            y = ~geog_area,
            type = 'bar',
            hovertemplate = paste("%{x:,.0f}")) %>%
  layout(xaxis = list(tickformat = ",",
                      type = "log"),
         yaxis = list(title = "",
                      autorange = "reversed"),
         barmode = 'stack',
         hovermode = 'y unified') %>%
  hide_legend()
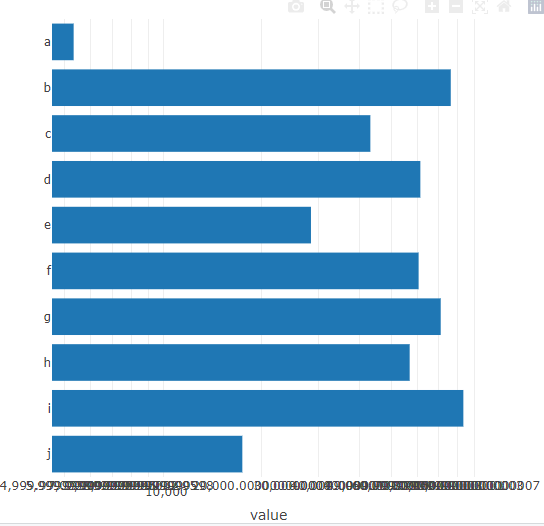
> sessionInfo()
R version 4.0.3 (2020-10-10)
Platform: x86_64-pc-linux-gnu (64-bit)
Running under: Ubuntu 18.04.5 LTS

Matrix products: default
BLAS:   /usr/lib/x86_64-linux-gnu/blas/libblas.so.3.7.1
LAPACK: /usr/lib/x86_64-linux-gnu/lapack/liblapack.so.3.7.1

locale:
 [1] LC_CTYPE=C.UTF-8       LC_NUMERIC=C           LC_TIME=C.UTF-8        LC_COLLATE=C.UTF-8     LC_MONETARY=C.UTF-8    LC_MESSAGES=C.UTF-8    LC_PAPER=C.UTF-8
 [8] LC_NAME=C              LC_ADDRESS=C           LC_TELEPHONE=C         LC_MEASUREMENT=C.UTF-8 LC_IDENTIFICATION=C

attached base packages:
[1] stats     graphics  grDevices utils     datasets  methods   base

other attached packages:
[1] tibble_3.1.0   plotly_4.9.4.1 ggplot2_3.3.3

loaded via a namespace (and not attached):
 [1] pillar_1.5.0      compiler_4.0.3    tools_4.0.3       digest_0.6.27     packrat_0.5.0     jsonlite_1.7.2    lifecycle_1.0.0   gtable_0.3.0      viridisLite_0.3.0
[10] pkgconfig_2.0.3   rlang_0.4.10      DBI_1.1.1         crosstalk_1.1.1   yaml_2.2.1        withr_2.4.2       dplyr_1.0.4       httr_1.4.2        generics_0.1.0
[19] vctrs_0.3.6       htmlwidgets_1.5.3 grid_4.0.3        tidyselect_1.1.0  glue_1.4.2        data.table_1.12.8 R6_2.5.0          fansi_0.4.2       purrr_0.3.4
[28] tidyr_1.1.3       blob_1.2.1        magrittr_2.0.1    scales_1.1.1      ellipsis_0.3.1    htmltools_0.5.1.1 assertthat_0.2.1  colorspace_2.0-0  utf8_1.1.4
[37] lazyeval_0.2.2    munsell_0.5.0     crayon_1.4.1
コントリビューションガイド
はじめの一歩
- issue を最後まで読み、次にプロジェクトのコントリビューションガイドを読みます。
- 着手することを issue にコメントします — 二人が同じ作業をするのを防げます。
- リポジトリをフォークし、ブランチを切って変更します。
- issue 番号を参照したプルリクエストを送ります。
調査の方向性
まず、提供されている R の例を plotly 4.9.4.1 で実行し、x 軸の対数目盛りのフォーマットを y 軸の場合と比較します。関連する plotly.R と JavaScript のパスで、対数軸と tickformat の処理を追跡します。完了条件は、再現可能な x 軸対数グラフで丸められた整数の目盛りが表示され、y 軸の動作を後退させないことです。
索引モデルが issue の本文から書いたものです。
評価
- 技術スタック
- d3js, javascript, r
- 領域
- data-visualization
- issue の種類
- バグ
- 難易度
- 4/5
- 見積もり時間
- 3〜5日
- 活発さ
- 停滞
- 明瞭さ
- おおむね明確
- 初心者へのやさしさ
- 35/100