Issue with log scale displaying floating point numbers when on x axis.
Nessuno ha ancora preso questa issue.
- Lingua principale
- R
- Stelle
- 2.7k
- Fork
- 641
- Metriche di merge delle PR
- Nessuna PR unita negli ultimi 30g
Descrizione
The log scale should display rounded integers, but is displaying floating points with many decimal places. Seems to be fine though when the log scale is on the y axis. Also does not happen all the time. Works for another graph I have.
Brief description of the problem
library(plotly)
library(tibble)


# fake data
df <- tibble(geog_area = letters[1:10],
             value = runif(10, 100, 100000))

plot_ly() %>%
  add_trace(data = df,
            x = ~value,
            y = ~geog_area,
            type = 'bar',
            hovertemplate = paste("%{x:,.0f}")) %>%
  layout(xaxis = list(tickformat = ",",
                      type = "log"),
         yaxis = list(title = "",
                      autorange = "reversed"),
         barmode = 'stack',
         hovermode = 'y unified') %>%
  hide_legend()
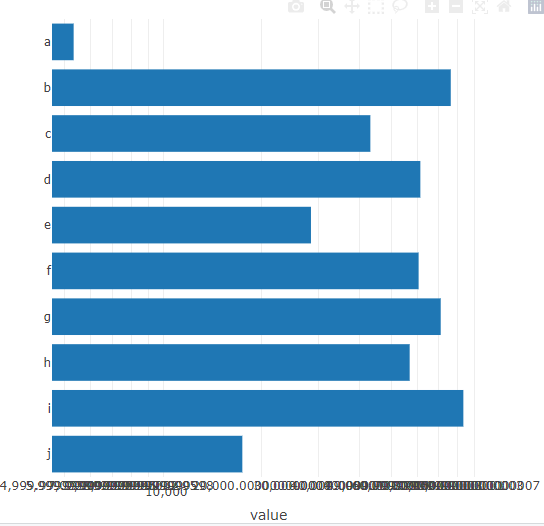
> sessionInfo()
R version 4.0.3 (2020-10-10)
Platform: x86_64-pc-linux-gnu (64-bit)
Running under: Ubuntu 18.04.5 LTS

Matrix products: default
BLAS:   /usr/lib/x86_64-linux-gnu/blas/libblas.so.3.7.1
LAPACK: /usr/lib/x86_64-linux-gnu/lapack/liblapack.so.3.7.1

locale:
 [1] LC_CTYPE=C.UTF-8       LC_NUMERIC=C           LC_TIME=C.UTF-8        LC_COLLATE=C.UTF-8     LC_MONETARY=C.UTF-8    LC_MESSAGES=C.UTF-8    LC_PAPER=C.UTF-8
 [8] LC_NAME=C              LC_ADDRESS=C           LC_TELEPHONE=C         LC_MEASUREMENT=C.UTF-8 LC_IDENTIFICATION=C

attached base packages:
[1] stats     graphics  grDevices utils     datasets  methods   base

other attached packages:
[1] tibble_3.1.0   plotly_4.9.4.1 ggplot2_3.3.3

loaded via a namespace (and not attached):
 [1] pillar_1.5.0      compiler_4.0.3    tools_4.0.3       digest_0.6.27     packrat_0.5.0     jsonlite_1.7.2    lifecycle_1.0.0   gtable_0.3.0      viridisLite_0.3.0
[10] pkgconfig_2.0.3   rlang_0.4.10      DBI_1.1.1         crosstalk_1.1.1   yaml_2.2.1        withr_2.4.2       dplyr_1.0.4       httr_1.4.2        generics_0.1.0
[19] vctrs_0.3.6       htmlwidgets_1.5.3 grid_4.0.3        tidyselect_1.1.0  glue_1.4.2        data.table_1.12.8 R6_2.5.0          fansi_0.4.2       purrr_0.3.4
[28] tidyr_1.1.3       blob_1.2.1        magrittr_2.0.1    scales_1.1.1      ellipsis_0.3.1    htmltools_0.5.1.1 assertthat_0.2.1  colorspace_2.0-0  utf8_1.1.4
[37] lazyeval_0.2.2    munsell_0.5.0     crayon_1.4.1
Guida per i contributori
Apri la guida per i contributori
Come iniziare
- Leggi tutta la issue e poi la guida ai contributi del progetto.
- Commenta sulla issue per dire che te ne occupi tu — evita che due persone facciano lo stesso lavoro.
- Fai un fork del repository e lavora su un branch.
- Apri una pull request che faccia riferimento al numero della issue.
Direzione di ricerca
Inizia eseguendo l'esempio R fornito con plotly 4.9.4.1 e confronta la formattazione delle tacche dell'asse logaritmico sull'asse x con il caso dell'asse y. Segui la gestione degli assi logaritmici e di tickformat nei percorsi rilevanti di plotly.R e JavaScript; il lavoro è completato quando i grafici riproducibili con asse x logaritmico mostrano tacche intere arrotondate senza introdurre regressioni nel comportamento dell'asse y.
Scritto dal modello di indicizzazione a partire dal testo della issue.
Valutazione
- Stack tecnologico
- d3js, javascript, r
- Ambito
- data-visualization
- Tipo di issue
- Bug
- Difficoltà
- 4/5
- Tempo stimato
- 3-5 giorni
- Stato di attività
- Ferma
- Chiarezza
- Abbastanza chiara
- Idoneità per principianti
- 35/100