Issue with log scale displaying floating point numbers when on x axis.
Dieses Issue hat noch niemand übernommen.
- Vorherrschende Sprache
- R
- Sterne
- 2.7k
- Forks
- 641
- PR-Merge-Kennzahlen
- Keine gemergten PRs in 30 T.
Beschreibung
The log scale should display rounded integers, but is displaying floating points with many decimal places. Seems to be fine though when the log scale is on the y axis. Also does not happen all the time. Works for another graph I have.
Brief description of the problem
library(plotly)
library(tibble)


# fake data
df <- tibble(geog_area = letters[1:10],
             value = runif(10, 100, 100000))

plot_ly() %>%
  add_trace(data = df,
            x = ~value,
            y = ~geog_area,
            type = 'bar',
            hovertemplate = paste("%{x:,.0f}")) %>%
  layout(xaxis = list(tickformat = ",",
                      type = "log"),
         yaxis = list(title = "",
                      autorange = "reversed"),
         barmode = 'stack',
         hovermode = 'y unified') %>%
  hide_legend()
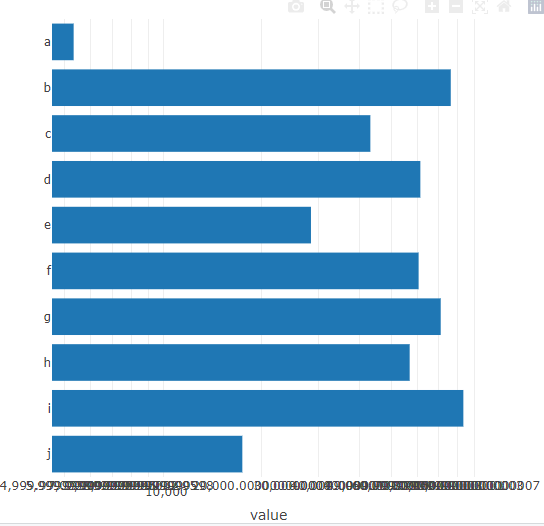
> sessionInfo()
R version 4.0.3 (2020-10-10)
Platform: x86_64-pc-linux-gnu (64-bit)
Running under: Ubuntu 18.04.5 LTS

Matrix products: default
BLAS:   /usr/lib/x86_64-linux-gnu/blas/libblas.so.3.7.1
LAPACK: /usr/lib/x86_64-linux-gnu/lapack/liblapack.so.3.7.1

locale:
 [1] LC_CTYPE=C.UTF-8       LC_NUMERIC=C           LC_TIME=C.UTF-8        LC_COLLATE=C.UTF-8     LC_MONETARY=C.UTF-8    LC_MESSAGES=C.UTF-8    LC_PAPER=C.UTF-8
 [8] LC_NAME=C              LC_ADDRESS=C           LC_TELEPHONE=C         LC_MEASUREMENT=C.UTF-8 LC_IDENTIFICATION=C

attached base packages:
[1] stats     graphics  grDevices utils     datasets  methods   base

other attached packages:
[1] tibble_3.1.0   plotly_4.9.4.1 ggplot2_3.3.3

loaded via a namespace (and not attached):
 [1] pillar_1.5.0      compiler_4.0.3    tools_4.0.3       digest_0.6.27     packrat_0.5.0     jsonlite_1.7.2    lifecycle_1.0.0   gtable_0.3.0      viridisLite_0.3.0
[10] pkgconfig_2.0.3   rlang_0.4.10      DBI_1.1.1         crosstalk_1.1.1   yaml_2.2.1        withr_2.4.2       dplyr_1.0.4       httr_1.4.2        generics_0.1.0
[19] vctrs_0.3.6       htmlwidgets_1.5.3 grid_4.0.3        tidyselect_1.1.0  glue_1.4.2        data.table_1.12.8 R6_2.5.0          fansi_0.4.2       purrr_0.3.4
[28] tidyr_1.1.3       blob_1.2.1        magrittr_2.0.1    scales_1.1.1      ellipsis_0.3.1    htmltools_0.5.1.1 assertthat_0.2.1  colorspace_2.0-0  utf8_1.1.4
[37] lazyeval_0.2.2    munsell_0.5.0     crayon_1.4.1
Beitragsleitfaden
Erste Schritte
- Lies das ganze Issue und danach den Beitragsleitfaden des Projekts.
- Schreib ins Issue, dass du es übernimmst — das erspart doppelte Arbeit.
- Forke das Repository und arbeite in einem Branch.
- Öffne einen Pull Request, der die Issue-Nummer nennt.
Rechercherichtung
Beginne damit, das bereitgestellte R-Beispiel mit plotly 4.9.4.1 auszuführen, und vergleiche die Formatierung der Logarithmus-Ticks auf der x-Achse mit dem Fall der y-Achse. Verfolge die Verarbeitung von Logarithmus-Achsen und tickformat in den relevanten plotly.R- und JavaScript-Pfaden; abgeschlossen ist die Arbeit, wenn reproduzierbare Logarithmusdiagramme auf der x-Achse gerundete ganzzahlige Ticks anzeigen, ohne das Verhalten der y-Achse zu beeinträchtigen.
Vom Indexierungsmodell aus dem Issue-Text verfasst.
Bewertung
- Tech-Stack
- d3js, javascript, r
- Bereich
- data-visualization
- Issue-Typ
- Bug
- Schwierigkeit
- 4/5
- Geschätzter Aufwand
- 3-5 Tage
- Aktivitätsstatus
- Veraltet
- Klarheit
- Größtenteils klar
- Anfängerfreundlichkeit
- 35/100