hline not rendering correct using ggplotly, geom_col, and stat_summary
Ouverte
Personne n'a encore pris cette issue.
- Langage dominant
- R
- Étoiles
- 2.7k
- Forks
- 641
- Métriques de merge des PR
- Aucune PR mergée en 30 j
Description
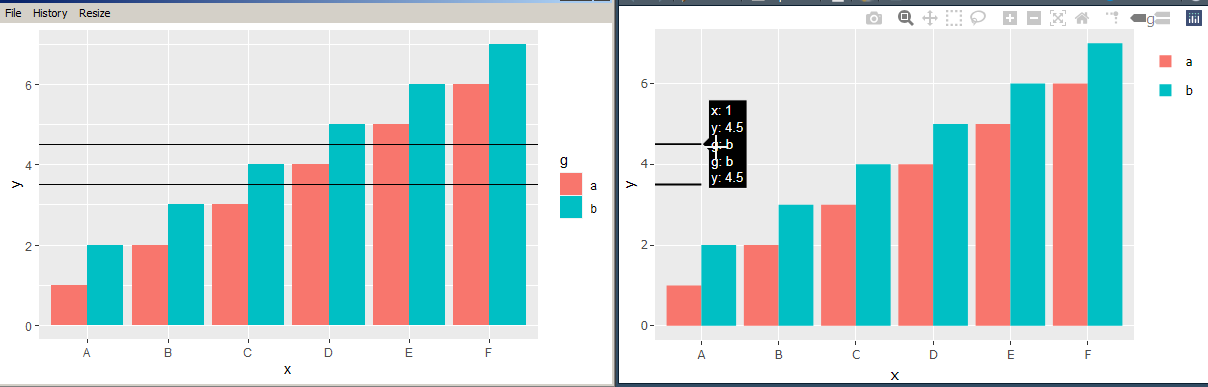
ggplotly does not render hline correctly across a geom_col, when using stat_summary.
ggplot draws the hline correctly across all x axis, but ggplotly cuts it off at first column. It should have hline across all x axis.
Thanks
library(ggplot2)
library(plotly)

df <- data.frame(x=LETTERS[1:6], y=c(1:6, 1:6 + 1), g=rep(x = c("a", "b"), each=6))

p<-ggplot(df, aes(x = x, y = y, fill = g, group = g)) +
  geom_col(position="dodge") + # geom_col is equivalent to geom_bar(stat = "identity")
  stat_summary(fun.y = mean, aes(x = 1, yintercept = ..y.., group = g), geom = "hline")

# This plot renders hline correctly across x axis
show(p)

#This plot does not render the hline across all x axis
p2<-ggplotly(p)
show(p2)
Guide de contribution
Ouvrir le guide de contribution
Par où commencer
- Lisez l'issue en entier, puis le guide de contribution du projet.
- Signalez en commentaire que vous la prenez — cela évite que deux personnes fassent le même travail.
- Forkez le dépôt et travaillez sur une branche.
- Ouvrez une pull request qui référence le numéro de l'issue.
Piste de recherche
Commencez par la reproduction R fournie en utilisant ggplot2, geom_col, stat_summary et ggplotly, en comparant le rendu natif de ggplot avec la sortie convertie. Suivez la manière dont la hline est représentée dans ggplotly et vérifiez que le résultat s’étend sur toutes les colonnes de l’axe x pour l’exemple fourni.
Rédigé par le modèle d'indexation à partir du texte de l'issue.
Évaluation
- Stack technique
- r
- Domaine
- data-visualization
- Type d'issue
- Bug
- Difficulté
- 4/5
- Temps estimé
- 3-5 jours
- Activité
- À l'abandon
- Clarté
- Plutôt claire
- Accessibilité débutants
- 35/100