hline not rendering correct using ggplotly, geom_col, and stat_summary
Offen
Dieses Issue hat noch niemand übernommen.
- Vorherrschende Sprache
- R
- Sterne
- 2.7k
- Forks
- 641
- PR-Merge-Kennzahlen
- Keine gemergten PRs in 30 T.
Beschreibung
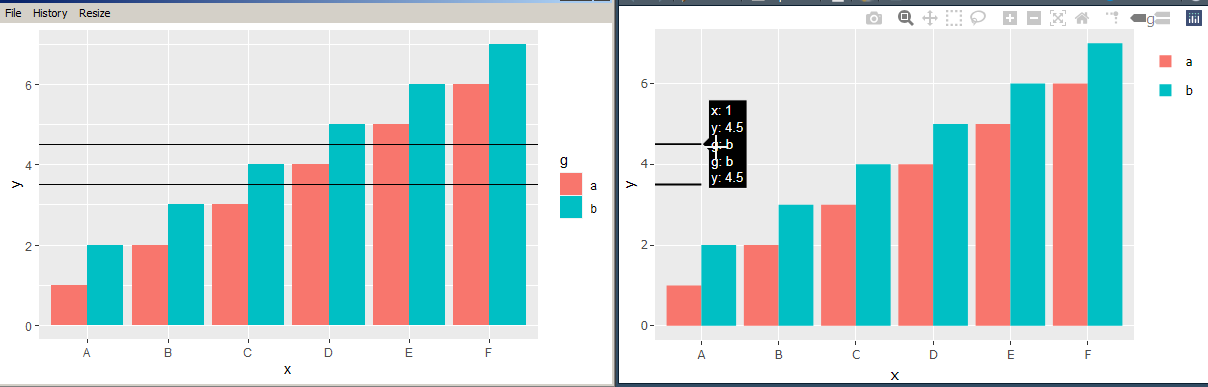
ggplotly does not render hline correctly across a geom_col, when using stat_summary.
ggplot draws the hline correctly across all x axis, but ggplotly cuts it off at first column. It should have hline across all x axis.
Thanks
library(ggplot2)
library(plotly)

df <- data.frame(x=LETTERS[1:6], y=c(1:6, 1:6 + 1), g=rep(x = c("a", "b"), each=6))

p<-ggplot(df, aes(x = x, y = y, fill = g, group = g)) +
  geom_col(position="dodge") + # geom_col is equivalent to geom_bar(stat = "identity")
  stat_summary(fun.y = mean, aes(x = 1, yintercept = ..y.., group = g), geom = "hline")

# This plot renders hline correctly across x axis
show(p)

#This plot does not render the hline across all x axis
p2<-ggplotly(p)
show(p2)
Beitragsleitfaden
Erste Schritte
- Lies das ganze Issue und danach den Beitragsleitfaden des Projekts.
- Schreib ins Issue, dass du es übernimmst — das erspart doppelte Arbeit.
- Forke das Repository und arbeite in einem Branch.
- Öffne einen Pull Request, der die Issue-Nummer nennt.
Rechercherichtung
Beginnen Sie mit der bereitgestellten R-Reproduktion unter Verwendung von ggplot2, geom_col, stat_summary und ggplotly, und vergleichen Sie die native ggplot-Darstellung mit der konvertierten Ausgabe. Verfolgen Sie, wie die hline in ggplotly dargestellt wird, und überprüfen Sie, dass das Ergebnis im bereitgestellten Beispiel alle Spalten der x-Achse umfasst.
Vom Indexierungsmodell aus dem Issue-Text verfasst.
Bewertung
- Tech-Stack
- r
- Bereich
- data-visualization
- Issue-Typ
- Bug
- Schwierigkeit
- 4/5
- Geschätzter Aufwand
- 3-5 Tage
- Aktivitätsstatus
- Veraltet
- Klarheit
- Größtenteils klar
- Anfängerfreundlichkeit
- 35/100