Plot does not show hoverinfo for first data point when default hovermode or set to 'closest'
オープン
まだ誰も着手していません。
- 主要言語
- R
- スター
- 2.7k
- フォーク
- 641
- PR マージ指標
- 30日以内にマージされた PR はありません
説明
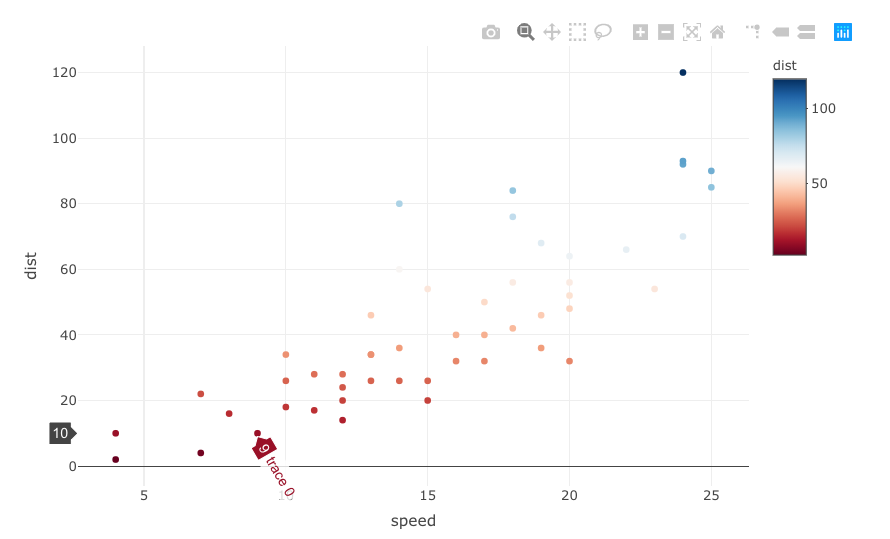
As written in the title, the hoverinfo for the first (bottom left) data point when layout.hovermode= 'closest' or kept as default does not appear.
# call library
library(plotly)

# reset fig
fig <- NULL

# add an extra line to check behavior on right hand side of graph
cars_one_extra_line <- rbind(cars,c(25,90))

# plot
fig <- plot_ly(cars_one_extra_line)
fig <- fig %>% add_trace(x = ~speed,
                         y = ~dist,
                         color = ~dist,
                         colors = 'RdBu',
                         type = 'scatter',
                         mode = 'markers')
fig <- fig %>% layout(hovermode = "closest")
fig
This is shown in the screenshot below. If the cursor is moved to the point above, the hoverinfo appears.

In an effort to understand the behavior, I also tried other tags. Strangely, the hovermode = 'y' also seems to have a weird behavior. Things to note are the following:
- text is tilted,
- text is sometimes obscured beyond the viewing frame (not shown in this example but does occur in certain cases),
- text is sometimes shown twice but in two places,
- y axis position is not always shown (for points at the top and bottom of the chart)

コントリビューションガイド
はじめの一歩
- issue を最後まで読み、次にプロジェクトのコントリビューションガイドを読みます。
- 着手することを issue にコメントします — 二人が同じ作業をするのを防げます。
- リポジトリをフォークし、ブランチを切って変更します。
- issue 番号を参照したプルリクエストを送ります。
調査の方向性
plot_ly、散布マーカー、および hovermode を "closest" または "y" に設定して、提供された R の再現コードを実行し、hover の欠落および不正な動作を確認します。R パッケージとそのインタラクティブなグラフ出力で使用される hover のレンダリングパスを追跡します。完了の条件は、最初の点に hoverinfo が表示され、報告されている hovermode のケースが、クリッピング、重複、軸位置の欠落なしに一貫してレンダリングされることです。
索引モデルが issue の本文から書いたものです。
評価
- 技術スタック
- r
- 領域
- data-visualization, frontend
- issue の種類
- バグ
- 難易度
- 4/5
- 見積もり時間
- 3〜5日
- 活発さ
- 停滞
- 明瞭さ
- おおむね明確
- 初心者へのやさしさ
- 38/100