Plot does not show hoverinfo for first data point when default hovermode or set to 'closest'
未关闭
还没有人认领这个 Issue。
- 主要语言
- R
- 星标
- 2.7k
- 派生
- 641
- PR 合并指标
- 30 天内没有已合并 PR
描述
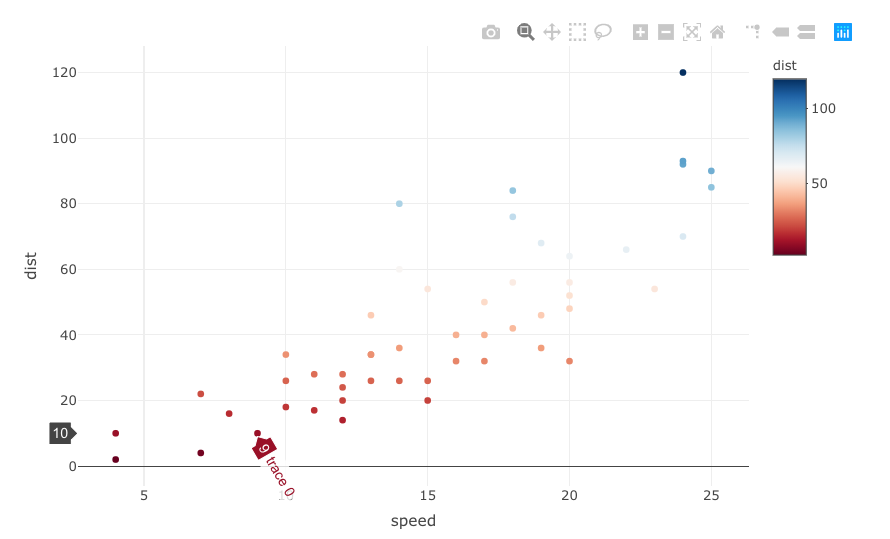
As written in the title, the hoverinfo for the first (bottom left) data point when layout.hovermode= 'closest' or kept as default does not appear.
# call library
library(plotly)

# reset fig
fig <- NULL

# add an extra line to check behavior on right hand side of graph
cars_one_extra_line <- rbind(cars,c(25,90))

# plot
fig <- plot_ly(cars_one_extra_line)
fig <- fig %>% add_trace(x = ~speed,
                         y = ~dist,
                         color = ~dist,
                         colors = 'RdBu',
                         type = 'scatter',
                         mode = 'markers')
fig <- fig %>% layout(hovermode = "closest")
fig
This is shown in the screenshot below. If the cursor is moved to the point above, the hoverinfo appears.

In an effort to understand the behavior, I also tried other tags. Strangely, the hovermode = 'y' also seems to have a weird behavior. Things to note are the following:
- text is tilted,
- text is sometimes obscured beyond the viewing frame (not shown in this example but does occur in certain cases),
- text is sometimes shown twice but in two places,
- y axis position is not always shown (for points at the top and bottom of the chart)

贡献指南
从这里开始
- 先读完整个 Issue,再读项目的贡献指南。
- 在 Issue 下留言说明你要接手 —— 这能避免两个人做同样的事。
- Fork 仓库,在一个分支上完成修改。
- 提交 Pull Request,并在描述里引用这个 Issue 编号。
调研方向
使用 plot_ly、散点标记,并将 hovermode 设置为 "closest" 或 "y",运行提供的 R 复现代码,以确认 hover 缺失和格式错误的行为。跟踪 R 包及其交互式图形输出所使用的 hover 渲染路径;完成的标准是第一个点显示 hoverinfo,并且报告的 hovermode 情况能够一致地渲染,不出现裁剪、重复或缺失轴位置。
由索引模型根据 Issue 内容生成。
评估
- 技术栈
- r
- 领域
- data-visualization, frontend
- Issue 类型
- 缺陷
- 难度
- 4/5
- 预计耗时
- 3-5 天
- 活跃度
- 停滞
- 描述清晰度
- 基本清楚
- 新手友好度
- 38/100