Plot does not show hoverinfo for first data point when default hovermode or set to 'closest'
Nessuno ha ancora preso questa issue.
- Lingua principale
- R
- Stelle
- 2.7k
- Fork
- 641
- Metriche di merge delle PR
- Nessuna PR unita negli ultimi 30g
Descrizione
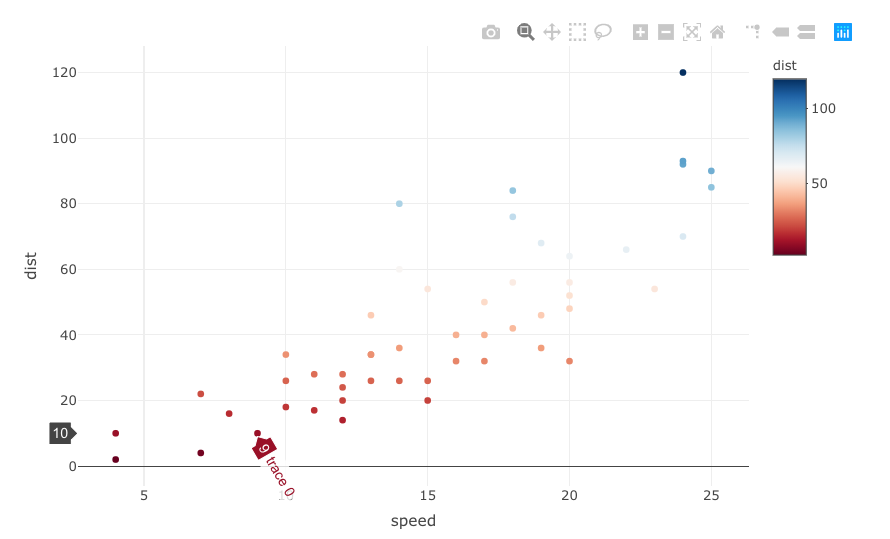
As written in the title, the hoverinfo for the first (bottom left) data point when layout.hovermode= 'closest' or kept as default does not appear.
# call library
library(plotly)

# reset fig
fig <- NULL

# add an extra line to check behavior on right hand side of graph
cars_one_extra_line <- rbind(cars,c(25,90))

# plot
fig <- plot_ly(cars_one_extra_line)
fig <- fig %>% add_trace(x = ~speed,
                         y = ~dist,
                         color = ~dist,
                         colors = 'RdBu',
                         type = 'scatter',
                         mode = 'markers')
fig <- fig %>% layout(hovermode = "closest")
fig
This is shown in the screenshot below. If the cursor is moved to the point above, the hoverinfo appears.

In an effort to understand the behavior, I also tried other tags. Strangely, the hovermode = 'y' also seems to have a weird behavior. Things to note are the following:
- text is tilted,
- text is sometimes obscured beyond the viewing frame (not shown in this example but does occur in certain cases),
- text is sometimes shown twice but in two places,
- y axis position is not always shown (for points at the top and bottom of the chart)

Guida per i contributori
Apri la guida per i contributori
Come iniziare
- Leggi tutta la issue e poi la guida ai contributi del progetto.
- Commenta sulla issue per dire che te ne occupi tu — evita che due persone facciano lo stesso lavoro.
- Fai un fork del repository e lavora su un branch.
- Apri una pull request che faccia riferimento al numero della issue.
Direzione di ricerca
Eseguire la riproduzione R fornita con plot_ly, marcatori di dispersione e hovermode impostato su "closest" o "y" per confermare il comportamento hover mancante e non corretto. Tracciare il percorso di rendering dell'hover utilizzato dal pacchetto R e dal relativo output grafico interattivo; il lavoro è completato quando il primo punto visualizza hoverinfo e i casi di hovermode segnalati vengono renderizzati in modo coerente, senza ritagli, duplicazioni o posizioni degli assi mancanti.
Scritto dal modello di indicizzazione a partire dal testo della issue.
Valutazione
- Stack tecnologico
- r
- Ambito
- data-visualization, frontend
- Tipo di issue
- Bug
- Difficoltà
- 4/5
- Tempo stimato
- 3-5 giorni
- Stato di attività
- Ferma
- Chiarezza
- Abbastanza chiara
- Idoneità per principianti
- 38/100