Plot does not show hoverinfo for first data point when default hovermode or set to 'closest'
Nadie ha tomado este issue todavía.
- Lenguaje dominante
- R
- Estrellas
- 2.7k
- Forks
- 641
- Métricas de merge de PR
- Sin PR fusionados en 30 d
Descripción
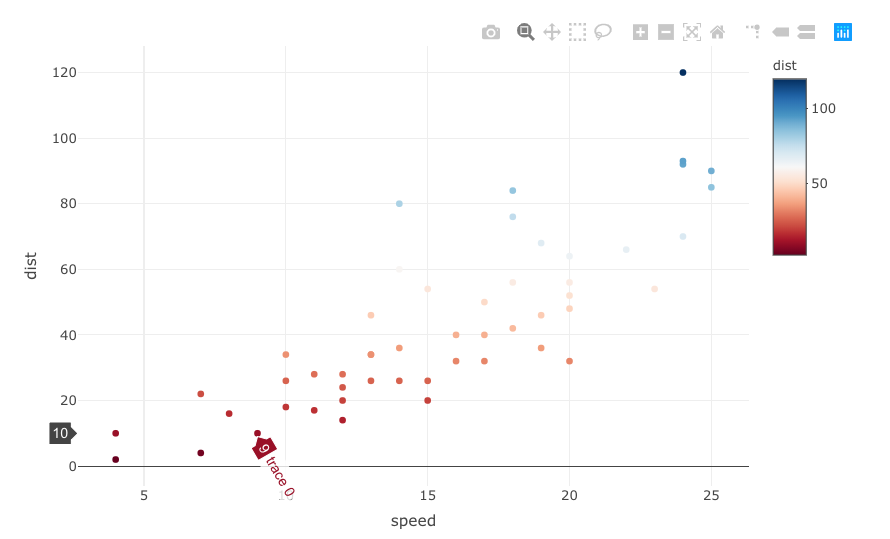
As written in the title, the hoverinfo for the first (bottom left) data point when layout.hovermode= 'closest' or kept as default does not appear.
# call library
library(plotly)

# reset fig
fig <- NULL

# add an extra line to check behavior on right hand side of graph
cars_one_extra_line <- rbind(cars,c(25,90))

# plot
fig <- plot_ly(cars_one_extra_line)
fig <- fig %>% add_trace(x = ~speed,
                         y = ~dist,
                         color = ~dist,
                         colors = 'RdBu',
                         type = 'scatter',
                         mode = 'markers')
fig <- fig %>% layout(hovermode = "closest")
fig
This is shown in the screenshot below. If the cursor is moved to the point above, the hoverinfo appears.

In an effort to understand the behavior, I also tried other tags. Strangely, the hovermode = 'y' also seems to have a weird behavior. Things to note are the following:
- text is tilted,
- text is sometimes obscured beyond the viewing frame (not shown in this example but does occur in certain cases),
- text is sometimes shown twice but in two places,
- y axis position is not always shown (for points at the top and bottom of the chart)

Guía de contribución
Primeros pasos
- Lee el issue completo y luego la guía de contribución del proyecto.
- Comenta en el issue que vas a ocuparte — evita que dos personas hagan lo mismo.
- Haz un fork del repositorio y trabaja en una rama.
- Abre un pull request que haga referencia al número del issue.
Línea de trabajo
Ejecute la reproducción de R proporcionada con plot_ly, marcadores de dispersión y hovermode establecido en "closest" o "y" para confirmar el comportamiento de hover ausente y mal formado. Rastree la ruta de renderizado de hover utilizada por el paquete de R y su salida de gráfico interactivo; se considera completado cuando el primer punto muestra hoverinfo y los casos de hovermode indicados se renderizan de forma coherente, sin recortes, duplicaciones ni posiciones de eje ausentes.
Escrito por el modelo de indexación a partir del texto del issue.
Evaluación
- Stack tecnológico
- r
- Área
- data-visualization, frontend
- Tipo de issue
- Error
- Dificultad
- 4/5
- Tiempo estimado
- 3-5 días
- Estado de actividad
- Estancado
- Claridad
- Bastante claro
- Aptitud para principiantes
- 38/100