`colors` argument to `add_trace` is ignored
オープン
まだ誰も着手していません。
- 主要言語
- R
- スター
- 2.7k
- フォーク
- 641
- PR マージ指標
- 30日以内にマージされた PR はありません
説明
This code
library(plotly)

x <- seq(1, 10)
y <- x ^ 1.5
color <- c("a", "b", "c", "d", "e",
           "f", "g", "h", "i", "j")

plot_ly(type = "scatter", mode = "markers",
        x = x, y = y,
        color = color,
        colors = "Dark2",
        mode = "markers")
works as expected and produces the following plot:
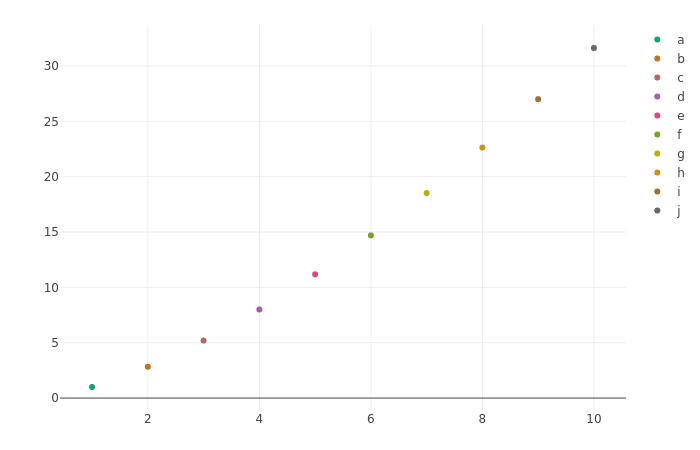
This one:
library(plotly)

x <- seq(1, 10)
y <- x ^ 1.5
color <- c("a", "b", "c", "d", "e",
           "f", "g", "h", "i", "j")

plt <- plot_ly(type = "scatter", mode = "markers")
plt <- add_trace(plt, x = x, y = y,
                 color = color,
                 colors = "Dark2",
                 mode = "markers")
plt
generates the warning
Warning messages:
1: In RColorBrewer::brewer.pal(N, "Set2") :
  n too large, allowed maximum for palette Set2 is 8
Returning the palette you asked for with that many colors

2: In RColorBrewer::brewer.pal(N, "Set2") :
  n too large, allowed maximum for palette Set2 is 8
Returning the palette you asked for with that many colors
and produces the following plot:

The colors argument is ignored.
The same happens when specifying a custom colour palette with colorRampPalette from RColorBrewer:
library(RColorBrewer)
library(plotly)

x <- seq(1, 10)
y <- x ^ 1.5
color <- c("a", "b", "c", "d", "e",
           "f", "g", "h", "i", "j")
colors <- colorRampPalette(brewer.pal(8, "Dark2"))(10)

plt <- plot_ly(type = "scatter", mode = "markers")
plt <- add_trace(plt, x = x, y = y,
                 color = color,
                 colors = colors,
                 mode = "markers")
plt
As far as I can see, this makes it impossible to programmatically build a plot with add_trace and also choose the colour palette at the same time.
コントリビューションガイド
はじめの一歩
- issue を最後まで読み、次にプロジェクトのコントリビューションガイドを読みます。
- 着手することを issue にコメントします — 二人が同じ作業をするのを防げます。
- リポジトリをフォークし、ブランチを切って変更します。
- issue 番号を参照したプルリクエストを送ります。
調査の方向性
まず issue にある plot_ly と add_trace の 2 つの例を再現し、次にエントリーポイント add_trace が color と colors をどのように処理するかを追跡します。add_trace が名前付きパレットとカスタムの colorRampPalette 出力の両方を適用し、報告されているパレット警告を出さなくなれば完了です。
索引モデルが issue の本文から書いたものです。
評価
- 技術スタック
- r
- 領域
- data-visualization
- issue の種類
- バグ
- 難易度
- 3/5
- 見積もり時間
- 1〜2日
- 活発さ
- 停滞
- 明瞭さ
- おおむね明確
- 初心者へのやさしさ
- 45/100