`colors` argument to `add_trace` is ignored
Personne n'a encore pris cette issue.
- Langage dominant
- R
- Étoiles
- 2.7k
- Forks
- 641
- Métriques de merge des PR
- Aucune PR mergée en 30 j
Description
This code
library(plotly)

x <- seq(1, 10)
y <- x ^ 1.5
color <- c("a", "b", "c", "d", "e",
           "f", "g", "h", "i", "j")

plot_ly(type = "scatter", mode = "markers",
        x = x, y = y,
        color = color,
        colors = "Dark2",
        mode = "markers")
works as expected and produces the following plot:
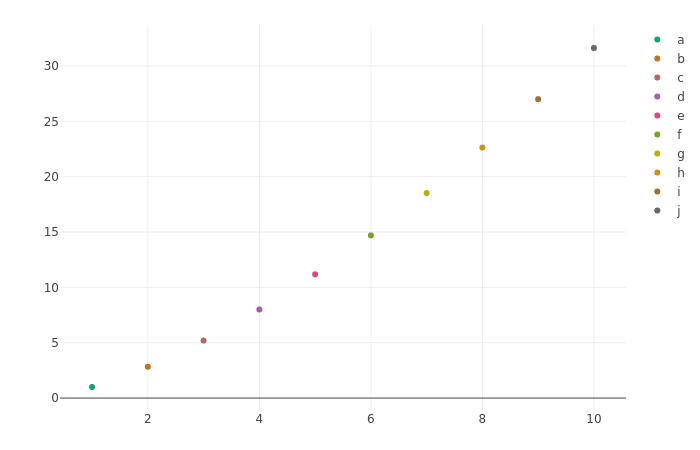
This one:
library(plotly)

x <- seq(1, 10)
y <- x ^ 1.5
color <- c("a", "b", "c", "d", "e",
           "f", "g", "h", "i", "j")

plt <- plot_ly(type = "scatter", mode = "markers")
plt <- add_trace(plt, x = x, y = y,
                 color = color,
                 colors = "Dark2",
                 mode = "markers")
plt
generates the warning
Warning messages:
1: In RColorBrewer::brewer.pal(N, "Set2") :
  n too large, allowed maximum for palette Set2 is 8
Returning the palette you asked for with that many colors

2: In RColorBrewer::brewer.pal(N, "Set2") :
  n too large, allowed maximum for palette Set2 is 8
Returning the palette you asked for with that many colors
and produces the following plot:

The colors argument is ignored.
The same happens when specifying a custom colour palette with colorRampPalette from RColorBrewer:
library(RColorBrewer)
library(plotly)

x <- seq(1, 10)
y <- x ^ 1.5
color <- c("a", "b", "c", "d", "e",
           "f", "g", "h", "i", "j")
colors <- colorRampPalette(brewer.pal(8, "Dark2"))(10)

plt <- plot_ly(type = "scatter", mode = "markers")
plt <- add_trace(plt, x = x, y = y,
                 color = color,
                 colors = colors,
                 mode = "markers")
plt
As far as I can see, this makes it impossible to programmatically build a plot with add_trace and also choose the colour palette at the same time.
Guide de contribution
Ouvrir le guide de contribution
Par où commencer
- Lisez l'issue en entier, puis le guide de contribution du projet.
- Signalez en commentaire que vous la prenez — cela évite que deux personnes fassent le même travail.
- Forkez le dépôt et travaillez sur une branche.
- Ouvrez une pull request qui référence le numéro de l'issue.
Piste de recherche
Commencez par reproduire les deux exemples de plot_ly et add_trace de l’issue, puis suivez la manière dont le point d’entrée add_trace gère color et colors. Le travail est terminé lorsque add_trace respecte à la fois la palette nommée et la sortie personnalisée de colorRampPalette, sans produire l’avertissement de palette signalé.
Rédigé par le modèle d'indexation à partir du texte de l'issue.
Évaluation
- Stack technique
- r
- Domaine
- data-visualization
- Type d'issue
- Bug
- Difficulté
- 3/5
- Temps estimé
- 1-2 jours
- Activité
- À l'abandon
- Clarté
- Plutôt claire
- Accessibilité débutants
- 45/100