`colors` argument to `add_trace` is ignored
Nobody has claimed this yet.
- Dominant language
- R
- Stars
- 2.7k
- Forks
- 641
- PR merge metrics
- No merged PRs in 30d
Description
This code
library(plotly)

x <- seq(1, 10)
y <- x ^ 1.5
color <- c("a", "b", "c", "d", "e",
           "f", "g", "h", "i", "j")

plot_ly(type = "scatter", mode = "markers",
        x = x, y = y,
        color = color,
        colors = "Dark2",
        mode = "markers")
works as expected and produces the following plot:
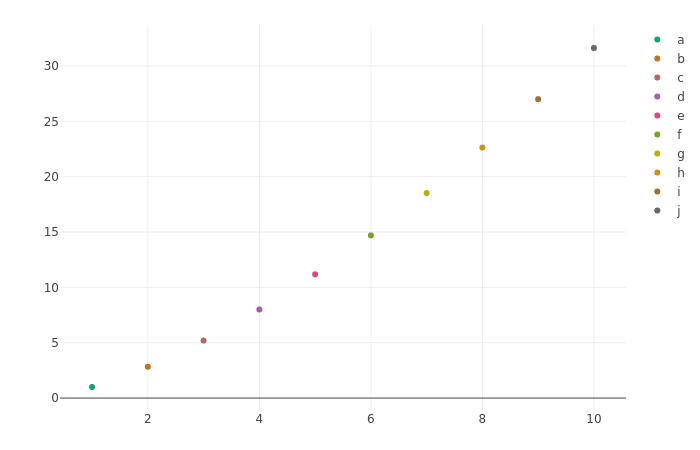
This one:
library(plotly)

x <- seq(1, 10)
y <- x ^ 1.5
color <- c("a", "b", "c", "d", "e",
           "f", "g", "h", "i", "j")

plt <- plot_ly(type = "scatter", mode = "markers")
plt <- add_trace(plt, x = x, y = y,
                 color = color,
                 colors = "Dark2",
                 mode = "markers")
plt
generates the warning
Warning messages:
1: In RColorBrewer::brewer.pal(N, "Set2") :
  n too large, allowed maximum for palette Set2 is 8
Returning the palette you asked for with that many colors

2: In RColorBrewer::brewer.pal(N, "Set2") :
  n too large, allowed maximum for palette Set2 is 8
Returning the palette you asked for with that many colors
and produces the following plot:

The colors argument is ignored.
The same happens when specifying a custom colour palette with colorRampPalette from RColorBrewer:
library(RColorBrewer)
library(plotly)

x <- seq(1, 10)
y <- x ^ 1.5
color <- c("a", "b", "c", "d", "e",
           "f", "g", "h", "i", "j")
colors <- colorRampPalette(brewer.pal(8, "Dark2"))(10)

plt <- plot_ly(type = "scatter", mode = "markers")
plt <- add_trace(plt, x = x, y = y,
                 color = color,
                 colors = colors,
                 mode = "markers")
plt
As far as I can see, this makes it impossible to programmatically build a plot with add_trace and also choose the colour palette at the same time.
Contributor guide
First steps
- Read the whole issue, then the project's contributing guide.
- Comment on the issue to say you are picking it up — it saves two people doing the same work.
- Fork the repository and make your change on a branch.
- Open a pull request that references the issue number.
Research direction
Start by reproducing the two plot_ly and add_trace examples in the issue, then trace how the add_trace entry point handles color and colors. Done means add_trace honors both the named palette and the custom colorRampPalette output without the reported palette warning.
Written by the indexing model from the issue text.
Assessment
- Tech stack
- r
- Domain
- data-visualization
- Issue type
- Bug
- Difficulty
- 3/5
- Estimated time
- 1-2 days
- Activity status
- Stale
- Clarity
- Mostly clear
- Newbie friendliness
- 45/100